
US markets is closed on Monday in observance of Memorial Day. As the turbulent month in equity markets is drawing to a close, investors will be looking ahead to Friday’s nonfarm payrolls report which could help set the market tone for June.
There has been a shift in the sentiment of the market but it remains unclear if it is a temporary or more permanent shift. Various points of interest have new bearings that have the stock market in a better place at the end of last week than it has been in some time. Recent encouraging economic data has fueled hopes that the Federal Reserve will be able to tighten monetary policy without tipping the economy into recession.
Here’s what you need to know to start your week.
1. Stocks to extend recovery?
U.S. equity markets rallied on Friday, with all three major indexes snapping their longest weekly losing streaks in decades, after better-than-expected economic data added to hopes that the Fed may not need to tighten monetary policy as much as previously feared.
Data on Friday showed that consumer spending rose more than expected in April and also indicated that inflation slowed.
The consumer spending data came after last Wednesday’s minutes of the Fed’s May meeting showed that “a number” of policymakers thought “monthly data might suggest that overall price pressures may no longer be worsening.”
The Fed has raised interest rates by 75 basis points so far this year and markets are pricing in 50 basis point rate hikes in June and July.
Key Economic Calendar (Weekly)
Friday’s nonfarm payrolls data for May is expected to show that the labor market remains robust, with economists expecting the economy to have added 320,000 jobs in May, slowing from 428,000 in April. While still firm it would represent the smallest jobs growth in around a year.
Wage growth is expected to remain solid amid a shortage of workers and the unemployment rate is expected to tick down to 3.5%.
The economic calendar also features data on private sector hiring, JOLTS job openings, a closely watched indicator of demand in the labor market and weekly figures on initial jobless claims.
ISM data on manufacturing and service sector activity will be in the spotlight amid concerns over the impact of rising prices and supply chain issues.
All times listed are EDT
Monday
US markets closed for Memorial Day holiday
Wednesday
10:00: US – ISM Manufacturing PMI: foreseen to edge up to 54.5 from 54.4.
10:00: US – JOLTs Job Openings: predicted to slip lower to 11.400M from 11.549M.
Thursday
8:15: US – ADP Nonfarm Employment Change: forecast to rise to 300K from 247K.
Friday
8:30: US – Nonfarm Payrolls: to drop to 320K from 428K.
8:30: US – Unemployment Rate: predicted to inch down to 3.5% from 3.6%.
10:00: US – ISM Non-Manufacturing PMI: to edge down to 56.4 from 57.1.
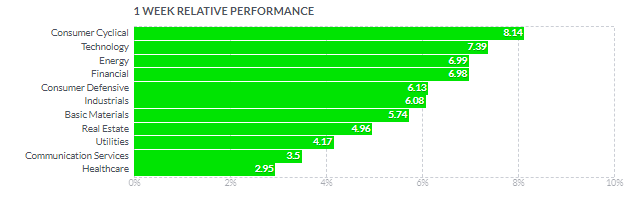
Top 3 Leading and Lagging Sectors (Weekly)
All eleven sectors finished the week in positive territory with the consumer cyclical (+8.1%) sector leading the way after underperforming earlier this month. The sector narrowed its May loss to -9.12%, largely thanks to a bounce in retail stocks after concerns about inflation and strength of consumer spending sent many of these names to their lowest levels in over a year. However, the past week saw renewed interest in retailers on hopes that the worst is in the past.

Market Breath (Weekly)
% of Stocks Above 50 DMA = 38.46% (+120.53%)
% of Stocks Above 200 DMA = 28.70% (+33.74%)

Market Technicals – (S&P 500, NASDAQ, Bitcoin, Bonds & Credit Spread, NAAIM)

$SPX (S&P 500) vs $RSP (S&P 500 Equal Weight) – (Net High/Low +72)
The S&P 500 ($SPX) broke a seven-week losing streak during the past week, rallying 6.6% after hitting its lowest level since March 2021 last Friday. The Nasdaq (+6.8%) outperformed slightly while the Dow (+6.2%) lagged a bit but was able to snap its longest weekly losing streak since 1932. The first two sessions of the week saw some volatility, but the market rallied strongly after the S&P 500 managed to stay above last week’s low during Tuesday’s affair, bouncing off the 3,858 support highlighted.
Mega cap names also did some heavy lifting with the likes of Apple ($AAPL), NVIDIA ($NVDA), and Tesla ($TSLA) contributing to the rally during the second half of the week. The trio gained between +8.3% and +14.5%. At the current junction, $SPX have broke through its 6 weeks downtrend channel, recapturing above its short term moving averages of 10-day and 20-day respectively – signifying a likelihood of further extension in this relief rally.
The immediate support to watch for this week remains at 3,858 level, the lowest level traded for the whole of 2022.

$QQQ (Nasdaq 100) vs $QQQE (Nasdaq 100 Equal Weight) – Further Extension of Bear Market Relief Rally
Tech and growth names have been hard hit since the start of 2022 by a rapid rise in Treasury yields on the back of expectations that the Fed will hike interest rates aggressively to combat high inflation as higher rates can hurt their companies with high valuations based on the prospect of future profits.
$QQQ gained +7.1% over the week, recovering the previous two weeks of losses. Similar to $SPX, $QQQ is have also broken through its downtrend channel, recapturing above its short term moving averages of 10-day and 20-day respectively – signifying a likelihood of further extension in this relief rally.
The support level to watch for $QQQ this week is at $280, the lowest level traded year to date.

$BTCUSD (Bitcoin / USD) – Bearish Head and Shoulder Pattern Remains In Play
Bitcoin ($BTCUSD) continued its weekly loss for the 8th consecutive week, falling -2.70% last week. At the current juncture, the highlighted Bearish Head and Shoulder Pattern remains in play.
The level of support to watch for $BTCUSD remains at $25,400, a breakdown of 12th May’s high volume reversal.

$PCCE (Put/Call Ratio Equity) & $VIX (Volatility S&P 500) – $PCCE Coming Off Towards Risk-On Level But $VIX Remains At Elevated Level For Caution
The spike level to watch for $PCCE in the last 24 months period is at 1.00. The current reading of 0.706 (-34.12%) implies a probable risk-on sentiment of the equity market in near term. The critical level to watch for $PCCE is at 1.20 for further accelerated sell off in the equities market.
The CBOE Volatility index ($VIX), also known as Wall Street’s fear gauge, also came lower to 25.71 (-12.61%), but remains at an elevated level for caution. While the index is elevated compared to its long-term average, it is still below levels reached in other major selloffs.

$IEI/$HYG (Credit Spread) – $TNX (10YR Treasury Yield) – Treasuries Recorded Third Week of Gains Reviving Optimism
Market participants are keeping a close watch on credit spreads as one of the better economic signals. Junk bond issuers are perceived to be bigger credit risks, so if economic growth slows or contracts, there will be increased angst that these issuers won’t be able to make good on their interest payments. Hence, a widening high-yield spread is regarded as a leading indicator of difficult economic times which, in turn, often invites a more challenging period for the stock market since difficult economic times translate into weaker earnings prospects.
Credit Spread narrowed from its highest level in 14 months recorded the previous week, sitting at 1.51% (-0.07), one of the biggest weekly decline in recent months.
Treasuries recorded their third consecutive week of gains, drawing some strength from speculation that the Fed could pause its rate hikes in September. The 10-yr yield finished the week at 2.744% (-1.58%)

NAAIM Exposure Index 33.19 (+13.68)
The NAAIM Exposure Index represents the average exposure to US Equity markets reported by members of the National Association of Active Investment Managers. It provides insight into the actual adjustments active risk managers have made to client accounts over the past two weeks. The blue line depicts a two-week moving average of the NAAIM managers’ responses.
This week’s NAAIM Exposure Index number is: 33.19, coming off from its lowest level of the past 24 months recorded in the previous week.
Top Trading Ideas for the Week
$AN remains in my WL for an entry position at $126.40. recaptured significant levels above VWAP from ATH and early april’s swing low. pic.twitter.com/ezTPjiRP96
— Jeff Sun, CFTe (@jeffsuntrading) May 30, 2022
$FNKO rebounded off its 50MA without further whipsaw that was displayed over the past year. VWAP from ATH coincides with the recent ER gap, acting as a cushion and a level to manage risk.
short term moving averages remains in inclination mode pic.twitter.com/Pa9bJtRSAF
— Jeff Sun, CFTe (@jeffsuntrading) May 30, 2022

