

The first half of what has been an exceptionally turbulent year in markets is ending (worst first half of the year in a decade), with investors wondering whether the next six months could bring some respite or more volatility. Major Indexes are down between -13.3% (Dow Jones Industrial) to -25.8% (Nasdaq) year-to-date. The rally effort last week points to similar technical characteristic of oversold bear rally that took place in the week on 20th May last month.
The European Central Bank (ECB) will hold its annual retreat in Portugal (Sintra Forum), where President Christine Lagarde, along with Federal Reserve Chair Jerome Powell and Bank of England Governor Andrew Bailey will appear at a panel discussion on Wednesday. Investors will be seeking for clues on how the central banks view the trade-off between curbing inflation while still trying to ensure a soft-landing for the global economy.
The economic calendar features the PCE price index – an inflation gauge watched by the Fed – along with the latest ISM Manufacturing PMI.
Here’s what you need to know to start your week.
1. Torrid first half draws to a close
Six months characterized by the fastest rate-hiking cycle in decades, market turmoil and a war that spurred spiraling inflation are drawing to a close, leaving investors to ponder what the second half may bring.
The S&P 500 is down around -18% year-to-date, and bonds have fared little better: The U.S. bond market, as measured by the Vanguard Total Bond Market Index Fund ($BND), is down -10.8% for the year to date.
With investor expectations fluctuating between continued high inflation and an economic downturn caused by a hawkish Fed, few believe the market’s volatility will subside anytime soon.
2. Sintra forum
The ECB’s three-day forum in Portugal’s Sintra gets underway on Monday against a backdrop of worries over whether central bank moves to stamp out the strongest inflation surge in decades could tip the global economy into a recession.
The forum will be focusing on “challenges for monetary policy in a rapidly changing world.”
Investors will be closely watching Wednesday’s panel discussion with Lagarde, Powell and Bailey for insights on how the central bank heads view the trade-off between curbing inflation while still trying to ensure a soft-landing for the global economy.
Key Economic Calendar (Weekly)
The U.S. is to release a raft of economic data in the coming week which will show how the economy is faring amid the Fed’s aggressive rate hiking cycle.
Investors will be closely watching Thursday’s May data on the personal consumption expenditures price index for indications on whether inflation is cooling.
Economists are expecting durable goods orders to slow, consumer confidence to deteriorate further and manufacturing surveys to weaken further, adding to concerns over the economic outlook.
The ISM Manufacturing PMI is seen pointing to the slowest growth in factory activity since July 2020
All times listed are EDT
Tuesday
4:30: Eurozone – ECB President Lagarde Speaks
10:00: US – CB Consumer Confidence: likely dropped to 100.9 from 106.4.
Wednesday
9:30: UK – BoE Gov Bailey Speaks
9:30: US – Fed Chair Powell Speaks
Thursday
8:30: US – Core PCE Price Index
Friday
10:00: US – ISM Manufacturing PMI: predicted to have edged down to 55.0 from 56.1.
Top 3 Leading and Lagging Sectors (Weekly)
The consumer cyclical (+10.1%), real estate (+9.4%), communication services (+9.1%), healthcare (+8.8%) and technology (+8.8%) sector outperformed the S&P 500 (+6.4%), whereas, the energy (-6.0%), materials (-1.4%) are the only two sector that ended the week on a loss.
If it wasn’t for Friday’s surge, the performance disparity would have been even greater.

Market Breath (Weekly)
% of Stocks Above 50 DMA = 31.98% (+118.29%)
% of Stocks Above 200 DMA = 19.10% (+21.42%)

Market Technicals – (S&P 500, NASDAQ, Bitcoin, Bonds & Credit Spread, NAAIM)

$SPX (S&P 500) vs $RSP (S&P 500 Equal Weight) – (Net High/Low -28)
$SPX marked its largest single day gain (+3.06%) on Friday’s session, setting a strong comeback week for the stock market. It was a short week, but it was long on big gains for the major indices. $SPX is up +6.45% for the week.
What transpired last week was a momentum-driven bounce from a deeply oversold condition. It was also a holiday shortened with an extremely light economic calendar week.
At the current junction, the rebound effort on $SPX did nothing to change the technical picture. The index remains in a clear downtrend with lower highs & and lower lows. The reactive bounce points to a similar rally effort that took place in the week of 20th May, sustaining for 18 calendar days.
The immediate support to watch for this week remains at 3,630 level, the lowest level traded year to date.

$QQQ (Nasdaq 100) vs $QQQE (Nasdaq 100 Equal Weight) – Remains the Weakest Major Index Year To Date
Tech and growth names have been hard hit since the start of 2022 by a rapid rise in Treasury yields on the back of expectations that the Fed will hike interest rates aggressively to combat high inflation as higher rates can hurt their companies with high valuations based on the prospect of future profits.
$QQQ rebound +7.65% for the week, erasing the losses over the previous week. Similar to $SPX, the rebound effort has done nothing to change the technical perspective of $QQQ at its current state.
The support level to watch for $QQQ this week remains at $269, the lowest level traded year to date.

$BTCUSD (Bitcoin / USD) – Bearish Head and Shoulder Pattern Remains In Play on Bigger Picture, Morphing out a Short Term Bearish Flag
Bitcoin ($BTCUSD) stabilized from previous week plunged with a negligible gain of +2.32% last week. At the current juncture, $BTCUSD is morphing out its second successive Bearish Flag pattern in two months.
The level of support to watch for $BTCUSD this week remains at $11,600, a major resistance-turned-support level.

$PCCE (Put/Call Ratio Equity) & $VIX (Volatility S&P 500) – Reflection of Imminent Major Sell Off Ahead
VIX >30 is assumed to accompany large volatility, resulting from increased uncertainty, risk, and investor fear. VIX <20 generally correspond to stable, stress-free periods in the market. Higher VIX levels equates to more expensive options premium and vice versa for lower VIX level.
The spike level to watch for $PCCE in the last 24 months period is at 1.00. The current reading of 0.647 (-47.64%) has certainly diminished the likelihood and risk of accelerated selling for this week.
The CBOE Volatility index ($VIX), also known as Wall Street’s fear gauge, also declined to 27.26 (-12.40%), but remains at elevated level for caution.
The weekly build up in momentum of both $PCCE and $VIX is reflecting a major sell off ahead remains imminent for the equities market.

$IEI/$HYG (Credit Spread) – $TNX (10YR Treasury Yield) – Yield Curve Flattening
Market participants are keeping a close watch on credit spreads as one of the better economic signals. Junk bond issuers are perceived to be bigger credit risks, so if economic growth slows or contracts, there will be increased angst that these issuers won’t be able to make good on their interest payments. Hence, a widening high-yield spread is regarded as a leading indicator of difficult economic times which, in turn, often invites a more challenging period for the stock market since difficult economic times translate into weaker earnings prospects.
Credit Spread further edge up towards 1.58% (-0.01) as the volatility in the equity market resumes. This is the highest spread level in 15 months.
The 2-yr note yield dropped 12 basis points this week to 3.06% after dipping below 2.90% earlier in the week. The 10-yr note yield dropped 11 basis points this week to 3.13% after flirting with 3.00% earlier in the week.

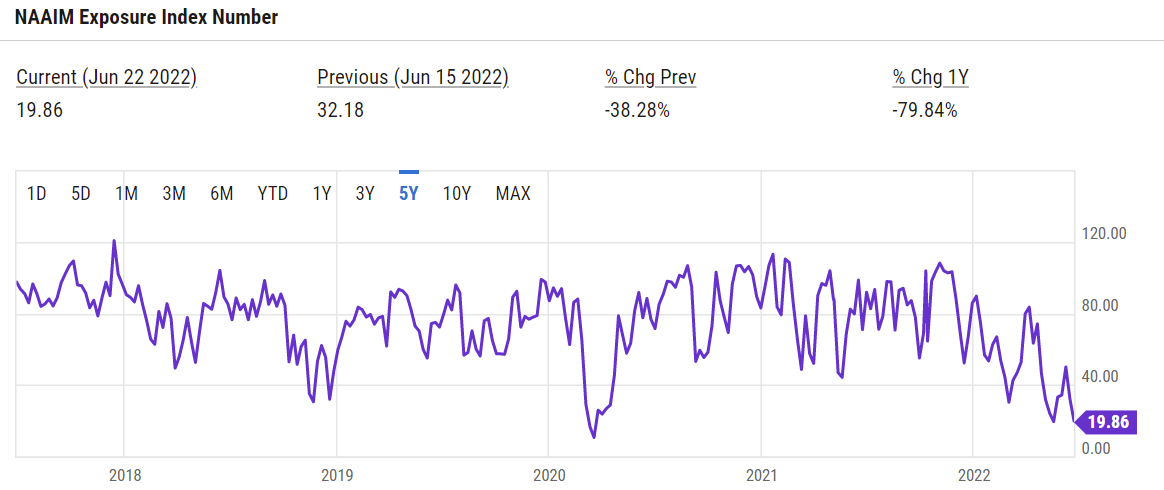
NAAIM Exposure Index 19.86 (-38.28%)
The NAAIM Exposure Index represents the average exposure to US Equity markets reported by members of the National Association of Active Investment Managers. It provides insight into the actual adjustments active risk managers have made to client accounts over the past two weeks. The blue line depicts a two-week moving average of the NAAIM managers’ responses.
This week’s NAAIM Exposure Index number is: 19.86.
Top Trading Ideas for the Week
$DQ – Semiconductor Equipment (China)
with many of the china names setting a new 52wks high, $DQ have rallied beyond its 15 months wedge pattern, trading above all KMAs to its rising 10/20 MAs.
what sets $DQ apart from other names is its exponentiated growth in latest pic.twitter.com/XuHbmsSZJc
— Jeff Sun, CFTe (@jeffsuntrading) June 20, 2022

