

There are legitimate reasons to be concerned about the world economic outlook and certainly in the context of global market turmoil. Including this week’s losses, the Dow, Nasdaq, S&P 500, and Russell 2000, declined -9.0%, -10.5%, -9.3%, and -9.7%, respectively in September. It is also worth to note that the US 2-Yr bonds yield and US 10-Yr bonds yield have displayed inversion since September. The worry for the market is that the Fed’s rush to normalization will go too far and create a material economic slowdown, if not an actual recessionary meltdown.
Investors will be looking closely at Friday’s U.S. jobs report to assess how much impact the Federal Reserve’s rate hikes are having on the economy. U.S. markets look set to remain volatile after closing the books on their third straight quarterly decline on Friday. Meanwhile, OPEC is reported to be considering a major production cut at its upcoming meeting on Wednesday.
Here’s what you need to know to start your week.
1. Stock market volatility
Markets are entering the final leg of 2022 after closing out a tumultuous third quarter on Friday, roiled by stubbornly high inflation, rising interest rates and recession fears.
Wall Street has posted three quarterly declines in a row, the longest losing streak for the S&P 500 and the Nasdaq since 2008 and the Dow’s longest quarterly slump in seven years.
As the Fed ramped up its monetary policy tightening to tame the worst inflation in decades, U.S. Treasury yields shot to their highest levels in more than a decade, slamming stock valuations.
Many investors believe the wild moves will continue until there is evidence that the Fed is winning its battle against inflation, allowing policymakers to eventually end monetary tightening.
2. OPEC meeting
The Organization of the Petroleum Exporting Countries and allies, including Russia, are to meet on Wednesday at OPEC’s headquarters in Vienna to finalize output quotas for November.
Earlier Sunday, Bloomberg reported that the group will consider cutting output by over 1 million barrels per day, against a backdrop of falling oil prices and severe market volatility.
Oil prices soared following Russia’s invasion of Ukraine in February but have since fallen back amid concerns over the impact of aggressive monetary tightening on the outlook for global growth. The stronger U.S. dollar has also weighed on prices.
Key Economic Calendar (Weekly)
Friday’s jobs report for September will show whether the Fed’s aggressive series of rate hikes is having an impact on the labor market. Economists are expecting the U.S. economy to have created 250,000 jobs last month, with the unemployment rate holding steady at 3.7% and wage growth staying elevated.
Recent jobs data have indicated that the labor market remains robust despite a series of jumbo-sized rate hikes.
Another strong jobs report could underline the case for even more hawkishness from the Fed, potentially roiling markets already hard hit by worries over how high rates may have to rise as the central bank battles the worst inflation in forty years.
On the other hand, indications that the labor market is slowing could add to fears that aggressive Fed tightening risks tipping the economy into a recession.
All times listed are EDT
Monday
10:00 US – ISM Manufacturing PMI m/m: forecast to decline from 52.8 to 52.5
Tuesday
10:00 US – JOLTS Jobs Opening: forecast to increase from 11.24M to 11.35M
Wednesday
8:15 US – ADP No-Farm Employment Change: forecast to increase from 132K to 200K
Friday
8:30 US – Non-Farm Employment Change m/m: forecast to decline form 315k to 265k
8:30 US – Unemployment Rate m/m: forecast to remain at 3.7%
Top 3 Leading and Lagging Sectors (Weekly)
The only sectors to end the week with a gain was energy (+1.8%) and basic materials (+0.9%). The remaining nine sectors recorded losses ranging from -0.6% (healthcare) to -8.0% (utilities).

Market Breath (Weekly)
% of Stocks Above 20 DMA = 10.50% (+43.64%)
% of Stocks Above 50 DMA = 11.76% (-0.17%)
% of Stocks Above 200 DMA = 16.60% (-1.43%)


Market Technicals – (S&P 500, NASDAQ, Bitcoin, Bonds & Credit Spread, NAAIM)

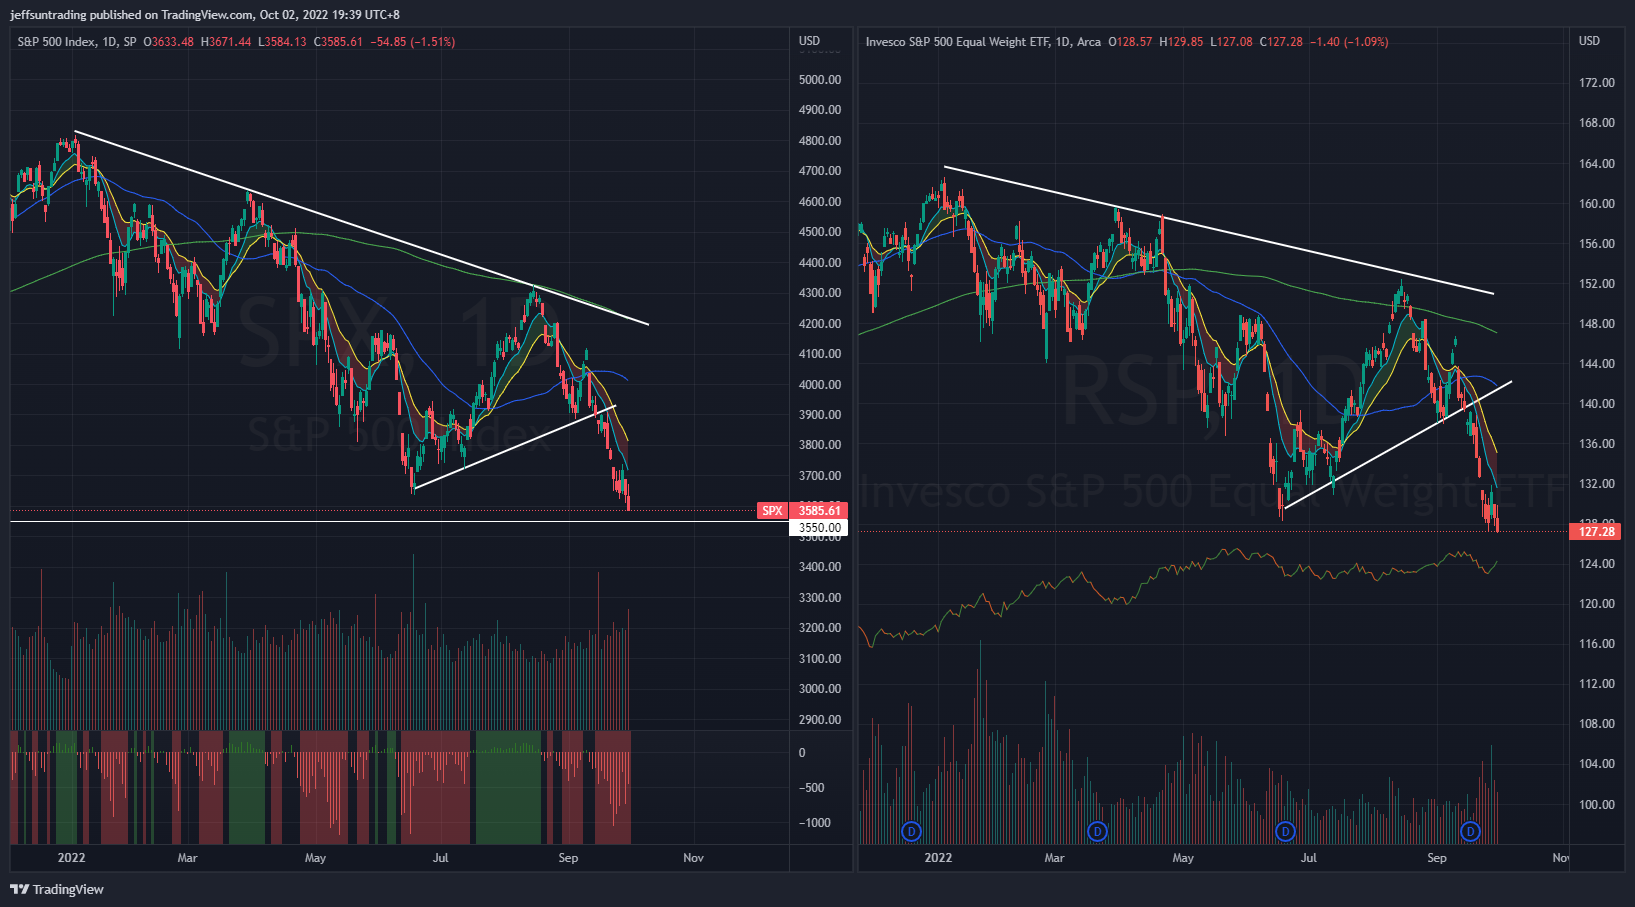
$SPX (S&P 500) vs $RSP (S&P 500 Equal Weight) – (Net High/Low -436)
$SPX (-2.91%) is trading beyond its year to date low, remaining below all major moving averages in declining fashion.
The support to watch for this week is at 3,550 level, a resistance turned support level during 2020 super-charged tech rally.
Bull Case: Reclaim above 4,000 50-day moving average level.
Bear Case: Breakdown of 3,550 a resistance turned support level during 2020. next support at 3,400 level.

$QQQ (Nasdaq 100) vs $QQQE (Nasdaq 100 Equal Weight) – Higher Treasury Yields To Continue Painful Transition For Stocks
Tech and growth names have been hard hit since the start of 2022 by a rapid rise in Treasury yields on the back of expectations that the Fed will hike interest rates aggressively to combat high inflation as higher rates can hurt their companies with high valuations based on the prospect of future profits.
$QQQ declined -2.99% for the week, remaining as the weakest major index year to date with -32.4% return.
Similar to $SPX, $QQQ is trading beyond its year to date low, remaining below all major moving averages in declining fashion.
The support level to watch for $QQQ this week is at 260 level, a previous support level in September 2020.
Bull Case: Reclaim above 305 50-day moving average.
Bear Case: Breakdown of 260, previous support level in 2020. The next support level is at 230.

$BTCUSD (Bitcoin / USD) – Bearish Pennant Forming Below 10/20-Day Moving Average
Bitcoin stalled from two consecutive week of losses with a +2.00% gain for last week. $BTCUSD remains below its declining 10 & 20 day-moving average. Similarly, long term moving averages such as 200-day and 50-day are all in declining fashion.
$BTCUSD is currently morphing out a Bearish Pennant pattern, a consolidated price action behavior that may prompt a further sell off in near term.
The level of support to watch for $BTCUSD this week remains at $18,157, the lowest level of the previous month before reaching its year till date low $17,590.
Bull Case: Reclaim above its existing 50-day moving averages at $20,400.
Bear Case: Breakdown of $18,157, a immediate support before reaching its year till date low $17,590.

$PCCE (Put/Call Ratio Equity) & $VIX (Volatility S&P 500) – Persistence in Reflection of Imminent Major Sell Off Ahead
VIX >30 is assumed to accompany large volatility, resulting from increased uncertainty, risk, and investor fear. VIX <20 generally correspond to stable, stress-free periods in the market. Higher VIX levels equates to more expensive options premium and vice versa for lower VIX level.
The spike level to watch for $PCCE in the last 24 months period is at 1.00. The current reading of 0.933 (-27.81%), declining from its highest reading since June from the previous week reflects a potential short term rally is underway.
Conversely, the VIX volatility index, also known as Wall Street’s fear gauge rise to 31.71 (+5.68%).
The weekly build up in momentum of both $PCCE and $VIX is reflecting a major sell off remains imminent for the equities market ahead.

$VIX/VXV – Reading at 1.00 (Uncertainty)
The VIX/VXV measures the ratio between 1-month implied volatility and 3-month implied volatility, which is helpful as it filters out higher baseline readings on VIX.
- If it is greater than one, it implies uncertainty, negative for equities. On the contrary, such high reading (i.e. spikes) coincide with market bottoms.
- If it is less than one, it implies tranquility, favorable for equities.
- If it is below 0.82, the returns for S&P500 are often less than stellar.

$IEI/$HYG (Credit Spread) – $TNX (10YR Treasury Yield) – 10-Year US Treasuries Yield Surged to 2010 Levels
Market participants are keeping a close watch on credit spreads as one of the better economic signals. Junk bond issuers are perceived to be bigger credit risks, so if economic growth slows or contracts, there will be increased angst that these issuers won’t be able to make good on their interest payments. Hence, a widening high-yield spread is regarded as a leading indicator of difficult economic times which, in turn, often invites a more challenging period for the stock market since difficult economic times translate into weaker earnings prospects.
Credit Spread inched up further to 1.60% (+0.01) for the week. The year to date high level is at 1.64%, set in early July.
Market rates have moved up appreciably this year. The 2-yr note yield, which started the year at 0.73%, is at 4.28%. The 10-yr note yield, which started the year at 1.51%, is at 3.80%. Normally, the 10-yr would be yielding more than the 2-yr, things have gotten abnormal, because, ironically, high inflation has necessitated a normalization of monetary policy.
The worry for the market is that the Fed’s rush to normalization will go too far and invite a material economic slowdown, if not an actual recession. Hence, the 2-yr note and the 10-yr note are inverted with the former yielding more than the latter. Rate-hike pressures have left investors taking money off the market as they await to hear more earnings warnings in coming weeks and months.

NAAIM Exposure Index 12.61 (-57.38%)
The NAAIM Exposure Index represents the average exposure to US Equity markets reported by members of the National Association of Active Investment Managers. It provides insight into the actual adjustments active risk managers have made to client accounts over the past two weeks. The blue line depicts a two-week moving average of the NAAIM managers’ responses.
This week’s NAAIM Exposure Index number is: 12.61 (Wednesday)
Top Trading Ideas for the Week
$CANO$CCRN$OSH$MLCO#Trading #MomentumLeaders #RelativeStrength pic.twitter.com/x9osMyzn3I
— Jeff Sun, CFTe (@jeffsuntrading) September 30, 2022