

Major US stock indices extended losses over the week as August CPI report gave market participants a reality check. It renewed concerns about persistently high inflation, an aggressive Fed rate-hike path, and a potential hard landing that would undercut current earnings estimates.
Nasdaq composite closed almost -5.5% lower, while S&P 500 and the Dow dropped -4.8% and -4.1%, respectively. This marks the fourth losing week out of the last five weeks for stocks and Tuesday’s sell-off was the fifth-largest point loss for the S&P 500 in history.
Next week will be dominated by interest rates decisions by the major central banks including Federal Reserve, with policymakers widely expected to deliver a third straight 75-basis-point rate hike on Wednesday.
Meanwhile, U.S. stocks look set for another volatile week amid fears that higher interest rates will see the economy run into trouble.
Here’s what you need to know to start your week.
1. Fed decision
Higher-than-expected U.S. inflation numbers for August have cemented expectations for another jumbo rate increase from the Fed at the conclusion of its meeting on Wednesday.
Markets have priced in a 75-basis-point rate increase, but some investors are bracing for a full percentage point hike – a move unthinkable just a short time ago.
Market watchers will be on high alert for how the U.S. central bank views the current pace of monetary tightening, the strength of the economy, and how likely inflation is to persist – as well as signs of how the balance sheet unwind is proceeding.
Some worry the process, in which the Fed cuts its balance sheet by $95 billion per month, could hurt market liquidity and weigh on the economy.
2. U.S. equities
U.S. stocks’ volatile run this year shows no signs of abating as stubbornly high inflation data makes it likely the Fed will continue to raise interest rates faster and further than previously expected, adding to chances of a recession.
Key Economic Calendar (Weekly)
Federal Reserve’s interest rate decision will be the most important event. A hotter-than-expected US inflation reading and signs that the job market remains robust cemented expectations for a third consecutive 0.75 percentage point rate hike, a move that would lift the fed funds rate to a target range of 3% to 3.25%. While less likely, signs of inflation becoming entrenched sparked speculation that a full percentage point increase could be on the table.
All times listed are EDT
Wednesday
14:00 US – FOMC Statement & Federal Funds Rate: forecast to increase by 0.75% to 3.25%
14:30 US – FOMC Press Conference
Friday
9:45: US – Flash Services PMI m/m: forecast to increase from 43.7 to 45.0
Top 3 Leading and Lagging Sectors (Weekly)
All 11 S&P 500 sectors registered losses for the week ranging from -2.8% (energy) to -6.5% (basic materials).
The communication services and technology sectors suffered the steepest losses after basic materials, closing down -6.4% and -6.1%, respectively.
Energy and health care were the “best” performing sectors this week, closing down -2.8% and -3.0%, respectively.

Market Breath (Weekly)
% of Stocks Above 20 DMA = 22.87% (-38.12%)
% of Stocks Above 50 DMA = 31.45% (-39.66%)
% of Stocks Above 200 DMA = 26.85% (-15.14%)


Market Technicals – (S&P 500, NASDAQ, Bitcoin, Bonds & Credit Spread, NAAIM)

$SPX (S&P 500) vs $RSP (S&P 500 Equal Weight) – (Net High/Low -433)
$SPX marks the fourth losing week out of the last five weeks declining -4.77%. $SPX have now fell below the psychologically important 3,900 level.
The stock market started the week on an upbeat note. Market participants had a rosy outlook for the future having latched onto the peak inflation, peak hawkishness, and soft-landing narratives. Upside momentum quickly fell to the wayside after the August CPI report gave market participants a reality check. It renewed concerns about persistently high inflation, an aggressive Fed rate-hike path, and a potential hard landing that would undercut current earnings estimates.
At the current juncture, $SPX have broken down from its short term trendline.
The support to watch for this week is at 3,837 level, the lowest level of the week.
Bull Case: Reclaim above 4,203 AVWAP from all time high. Immediate resistance at declining 200-day moving average and downtrend line.
Bear Case: Breakdown of 3,837 recent low. next support at 3,800.

$QQQ (Nasdaq 100) vs $QQQE (Nasdaq 100 Equal Weight) – Seasonal Headwind Suggested By 10 Years Data
Tech and growth names have been hard hit since the start of 2022 by a rapid rise in Treasury yields on the back of expectations that the Fed will hike interest rates aggressively to combat high inflation as higher rates can hurt their companies with high valuations based on the prospect of future profits.
$QQQ declined -5.79% for the week, remaining as the weakest major index year to date with -26.8% return.
It is worth to note that based on the past 10 years data, $QQQ has declined by an average of -0.6% in September—the only month of the year with a negative return.
The support level to watch for $QQQ this week is at 285 level, the week’s low.
Bull Case: Reclaim above 332 AVWAP from all time high, coinciding with its current 200-day moving average. Immediate resistance is at 335 classical resistance level.
Bear Case: Breakdown of 285, the recent low. The next support level is at 280.

$BTCUSD (Bitcoin / USD) – Declined Back Below 10/20-Day Moving Average
Bitcoin gave up previous week gain in entirety, declining -8.39% for the week. $BTCUSD is now back below its declining 10 & 20 day-moving average. Similarly, long term moving averages such as 200-day and 50-day are all in declining fashion.
The level of support to watch for $BTCUSD this week remains at $18,900, a immediate support before reaching its year till date low $17,590.
Bull Case: Reclaim above its existing 50-day moving averages at $21,600.
Bear Case: Breakdown of $18,900, a immediate support before reaching its year till date low $17,590.

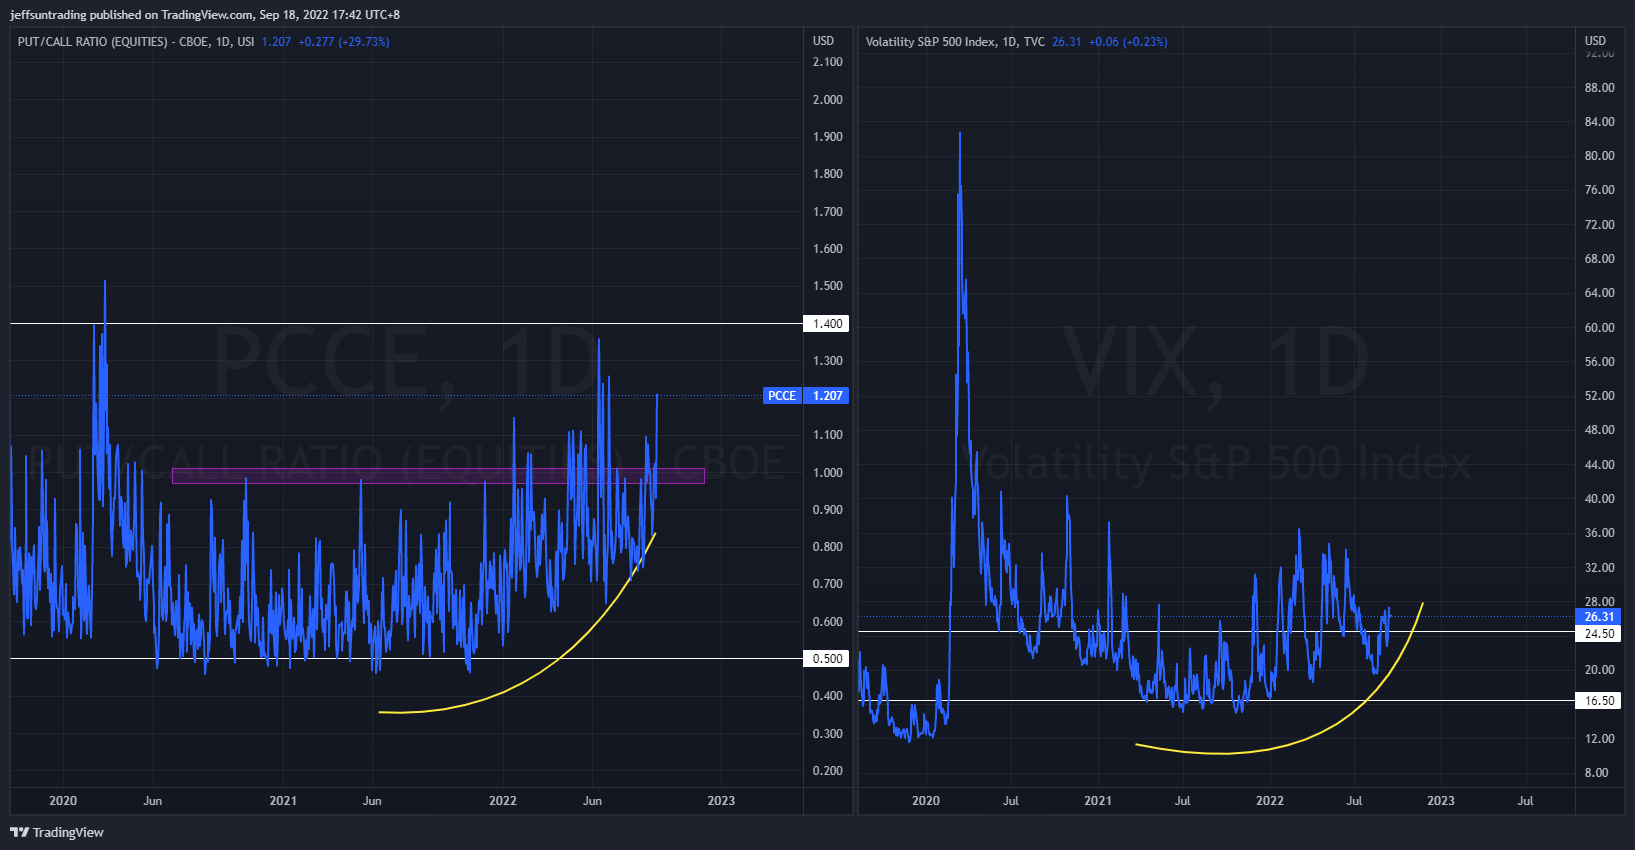
$PCCE (Put/Call Ratio Equity) & $VIX (Volatility S&P 500) – Persistence in Reflection of Imminent Major Sell Off Ahead
VIX >30 is assumed to accompany large volatility, resulting from increased uncertainty, risk, and investor fear. VIX <20 generally correspond to stable, stress-free periods in the market. Higher VIX levels equates to more expensive options premium and vice versa for lower VIX level.
The spike level to watch for $PCCE in the last 24 months period is at 1.00. The current reading of 1.207 (+45.40%) is the highest reading since June and it poses likelihood and risk of accelerated selling for the month of September.
Likewise, the VIX volatility index, also known as Wall Street’s fear gauge rise to 26.31 (+15.50%).
The weekly build up in momentum of both $PCCE and $VIX is reflecting a major sell off remains imminent for the equities market ahead.

$VIX/VXV – Reading at 0.95 (Tranquility)
The VIX/VXV measures the ratio between 1-month implied volatility and 3-month implied volatility, which is helpful as it filters out higher baseline readings on VIX.
- If it is greater than one, it implies uncertainty, negative for equities. On the contrary, such high reading (i.e. spikes) coincide with market bottoms.
- If it is less than one, it implies tranquility, favorable for equities.
- If it is below 0.82, the returns for S&P500 are often less than stellar.

$IEI/$HYG (Credit Spread) – $TNX (10YR Treasury Yield) – 10-Year US Treasuries Yield On Track For Year Till Date High
Market participants are keeping a close watch on credit spreads as one of the better economic signals. Junk bond issuers are perceived to be bigger credit risks, so if economic growth slows or contracts, there will be increased angst that these issuers won’t be able to make good on their interest payments. Hence, a widening high-yield spread is regarded as a leading indicator of difficult economic times which, in turn, often invites a more challenging period for the stock market since difficult economic times translate into weaker earnings prospects.
Credit Spread inched up to 1.57% (+0.02) for the week. The year to date high level is at 1.64%, set in early July.
Following August CPI report, the fed funds futures market shifted noticeably. It priced out any expectation of a 50-basis point increase at the September 20-21 FOMC meeting. Instead, it now prices in a 100% probability of a rate hike of at least 75 basis points at the next meeting. The 2-yr note yield, which is more sensitive to changes in the Fed funds rate, rose 28 basis points this week to 3.85%. The 10-yr note yield rose 13 basis points on the week to 3.45%.

NAAIM Exposure Index 33.86 (23.89%)
The NAAIM Exposure Index represents the average exposure to US Equity markets reported by members of the National Association of Active Investment Managers. It provides insight into the actual adjustments active risk managers have made to client accounts over the past two weeks. The blue line depicts a two-week moving average of the NAAIM managers’ responses.
This week’s NAAIM Exposure Index number is: 33.86 (Wednesday)
Top Trading Ideas for the Week
$OSH – Healthcare | Medical Care Facilities
the only name in my watchlist that could close at this week’s high with $SPX down -4.08% for the week.
RS is at new high before price as it made its first move out of triangle pattern. above all MAs and AVWAP from ATH. pic.twitter.com/losaLHZsWM
— Jeff Sun, CFTe (@jeffsuntrading) September 16, 2022
$RUN – Technology | Solar
broke out of a descending wedge during its most recent earnings report (QoQ growth in EPS and Sales) on high volume.
the past days of resilience in its price action tells alot of its strength in this market. already at RS high before price pic.twitter.com/k88Dv7WWEx
— Jeff Sun, CFTe (@jeffsuntrading) September 15, 2022
$FOUR – Tech | Software – Infrastructure
after a stellar earnings report on 4/8, it is coming off a base that is supported from all time low ($30) to rising 10/20 MAs.
latest close have reclaim its 200MA with a HTF setup. $50 clean pivot for BO pic.twitter.com/93NxQ9eamS
— Jeff Sun, CFTe (@jeffsuntrading) September 13, 2022