
The first week of June was a short one, but it ended up being long on disappointment as the major indices couldn’t build on the prior week’s strong gains. Instead, they fell victim to renewed selling interest that was a byproduct of concerns about the economic outlook, earnings outlook, and monetary policy outlook.
This week brings CPI reports in the U.S., as inflation remains the biggest concern at the Fed and other central banks. And with oil prices closing higher last week and a bevy of corporate rumblings over storm clouds ahead, reminders abound that a soft economic landing may be difficult to realize, no matter how strong the consumer is.
Here’s what to watch in the markets for the week ahead:
1. U.S. CPI Report
Friday’s U.S. CPI report for May comes a few days before the next Federal Reserve meeting, and will act as a final input before the Fed decides how much to hike rates. Inflation is expected to come in at 8.3% year over year, while core inflation (ex energy and fuel prices) is expected to come in at 5.9% year over year.
The latter number would mark a third month of consecutive declines and make the case that core inflation may have peaked, which would echo the slower wage growth in last week’s jobs report. At the same time, the overall inflation number of 8.3% would be close to peak, and given the pain at gas pumps and grocery stores, consumers may take little solace in knowing the core number is leveling out.
2. Oil’s next direction
OPEC+’s announced 50% production increase did little to slow the rise of crude, with both WTI Futures and Brent finishing the week just shy of $120/barrel. Despite rumblings of slowdowns, economic expansion (PMIs) and consumer demand suggest that demand for oil will remain high, and there are doubts that OPEC’s production increase will be enough or even be fully realized.
For the week ahead, eyes are on whether U.S. President Joe Biden will decide to meet with Saudi Crown Prince Mohammed bin Salman amid human rights concerns. As we enter the summer travel season, weekly crude inventories and gasoline inventories will be of interest, and they will likely correspond with the Michigan consumer sentiment survey, where readings are approaching 2008-09 lows (admittedly, lows also seen in the debt ceiling crisis of 2011, a reminder that the survey can reflect political sentiment as much as anything else).
3. Q1 Earnings season hits the homestretch
While we are through most of the Q1 earnings season, a few big names report numbers this week that will give read-throughs to various investing themes.
DocuSign Inc ($DOCU) is poised to report Thursday after the bell; the software as a service former highflyer was one of the first to start warning of slowing activity, and investors may now hope it will join the recent resurgence seen in names like Zoom Video Communications Inc ($ZM) or Okta ($OKTA). Smartsheet ($SMAR) (Tuesday) and Coupa Software Inc ($COUP) (Monday) are also among software companies reporting this week.
JM Smucker Company ($SJM) and Campbell Soup ($CPB) both report this week and may offer some insight into the impact of inflation in consumer staples. Likewise, Caseys General Stores ($CASY), Five Below (NASDAQ:FIVE), and Signet Jewelers Ltd ($SIG) all report from the retail sector, giving another round of inputs on consumer spending and appetite.
Nio ($NIO) reports earnings on Thursday, with the Chinese electric vehicle automaker near 52-week lows as it has struggled with coronavirus related lockdowns in China.
Key Economic Calendar (Weekly)
Friday
20:30: US – CPI m/m: foreseen to edge up to 0.7% from 0.3%.
Top 3 Leading and Lagging Sectors (Weekly)
The consumer cyclical sector (+3.1%) was the best-performing sector followed by communication services (+2.7%) and technology (+2.51%). Health care (-0.91%) and consumer staples (-0.27%) sectors extended their losses for another consecutive week.

Market Breath (Weekly)
% of Stocks Above 50 DMA = 40.24% (+4.63%)
% of Stocks Above 200 DMA = 27.83% (-3.03%)

Market Technicals – (S&P 500, NASDAQ, Bitcoin, Bonds & Credit Spread, NAAIM)

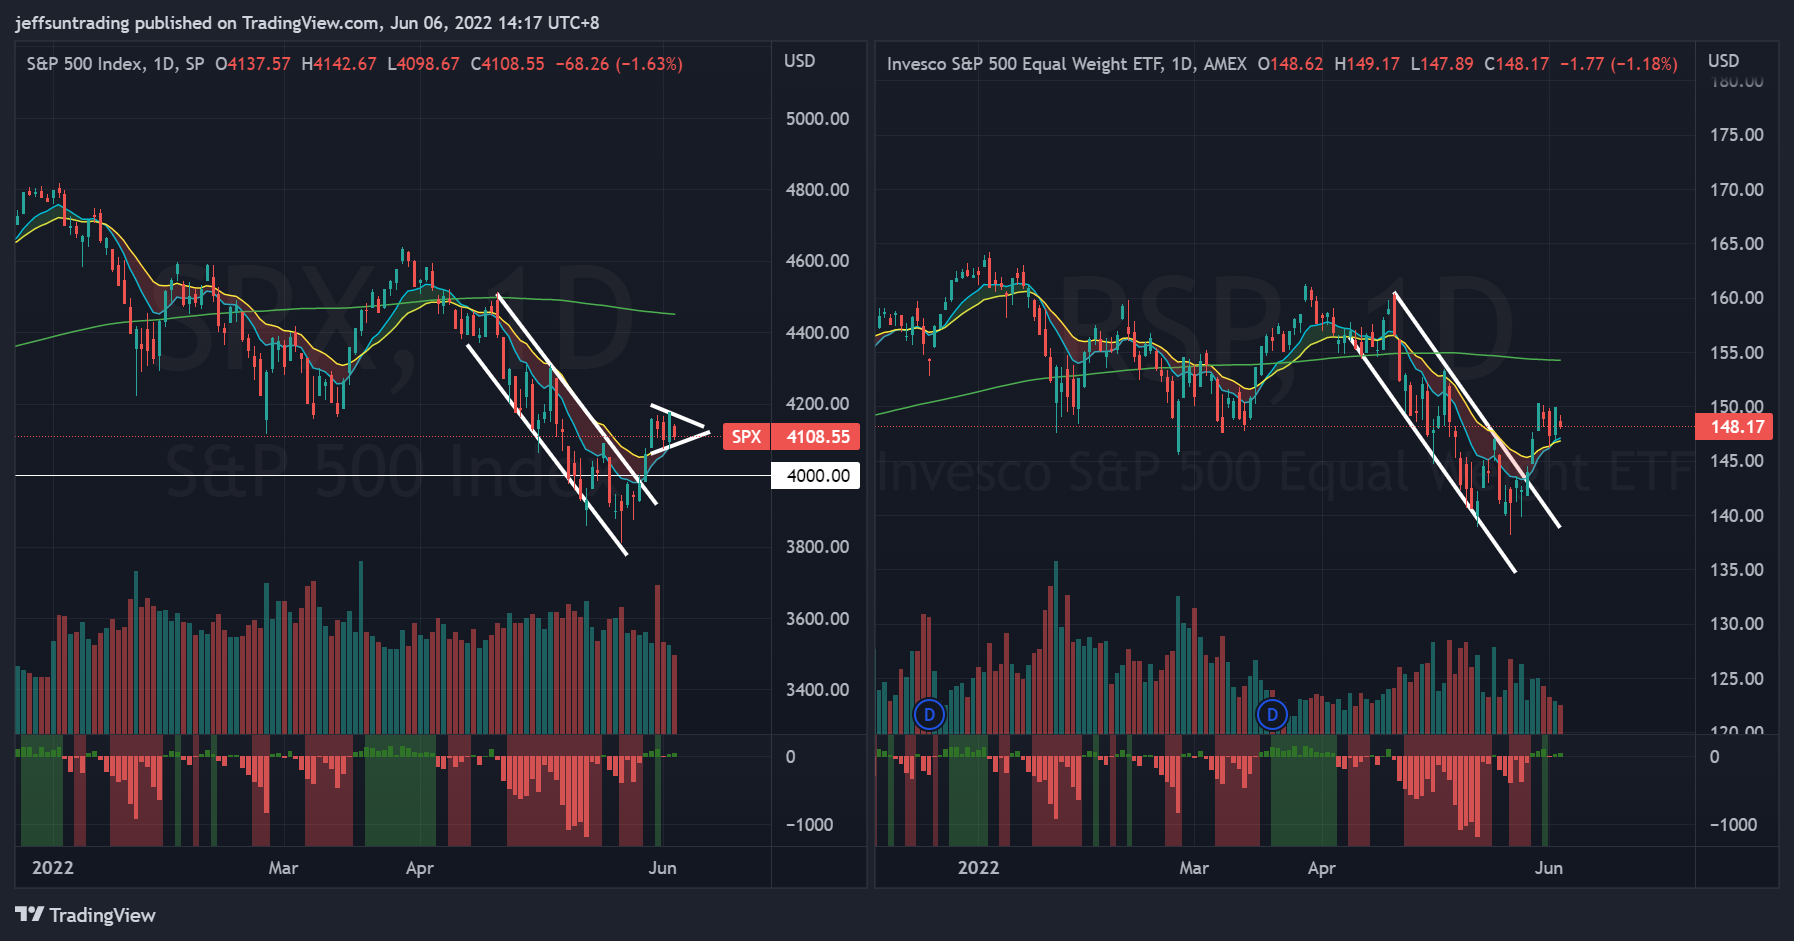
$SPX (S&P 500) vs $RSP (S&P 500 Equal Weight) – (Net High/Low +43)
The S&P 500 ($SPX) retreated -1.19% over the week, surrendering partial of its previous week gains. Equity indices had to contend with weak sentiment from the open after it was reported that Tesla($TSLA) CEO Musk sent an email to other executives at his company, expressing concern about the economy. Mr. Musk said that he has a “super bad feeling” about what is ahead, and that Tesla’s workforce needs to be reduced by about 10%.
At the current junction, $SPX have displayed a bullish wedge pattern, with short term price action momentum remaining above its short term moving averages of 10-day and 20-day respectively – signifying a likelihood of further extension in this relief rally.
The immediate support to watch for this week is at 4,000 level, a round number psychological support level.

$QQQ (Nasdaq 100) vs $QQQE (Nasdaq 100 Equal Weight) – Further Extension of Bear Market Relief Rally
Tech and growth names have been hard hit since the start of 2022 by a rapid rise in Treasury yields on the back of expectations that the Fed will hike interest rates aggressively to combat high inflation as higher rates can hurt their companies with high valuations based on the prospect of future profits.
$QQQ retraced -0.94% for the week. Similar to $SPX, $QQQ remains above its short term moving averages of 10-day and 20-day respectively – signifying a likelihood of further extension in this relief rally.
The support level to watch for $QQQ this week remains at $280, the lowest level traded year to date.

$BTCUSD (Bitcoin / USD) – Bearish Head and Shoulder Pattern Remains In Play
Bitcoin ($BTCUSD) gained +1.49% over the week. At the current juncture, the highlighted Bearish Head and Shoulder Pattern remains in play.
The level of support to watch for $BTCUSD is at $28,000, the lowest level closed over the past month sessions.

$PCCE (Put/Call Ratio Equity) & $VIX (Volatility S&P 500) – $PCCE and $VIX Reflects Movement Towards Neutrality
The spike level to watch for $PCCE in the last 24 months period is at 1.00. The current reading of 0.873 (+23.70%) implies a probable short term risk-off sentiment of the equity market for the week. The critical level to watch for $PCCE is at 1.20 for further accelerated sell off in the equities market.
The CBOE Volatility index ($VIX), also known as Wall Street’s fear gauge, lowered further to 24.80 (-3.54%), but remains at an elevated level for caution. While the index is elevated compared to its long-term average, it is still below levels reached in other major selloffs.

$IEI/$HYG (Credit Spread) – $TNX (10YR Treasury Yield) – Treasuries Recorded Fourth Straight Week of Gains Reviving Optimism
Market participants are keeping a close watch on credit spreads as one of the better economic signals. Junk bond issuers are perceived to be bigger credit risks, so if economic growth slows or contracts, there will be increased angst that these issuers won’t be able to make good on their interest payments. Hence, a widening high-yield spread is regarded as a leading indicator of difficult economic times which, in turn, often invites a more challenging period for the stock market since difficult economic times translate into weaker earnings prospects.
Credit Spread remains subtle from its highest level in 14 months recorded two weeks ago, sitting at 1.52% (+0.01).
Looking to the Treasury market, the 10-yr note yield ended the week up further at 2.95% while the 2-yr note yield jumped 21 basis points to 2.67%.

NAAIM Exposure Index 34.33 (+1.14)
The NAAIM Exposure Index represents the average exposure to US Equity markets reported by members of the National Association of Active Investment Managers. It provides insight into the actual adjustments active risk managers have made to client accounts over the past two weeks. The blue line depicts a two-week moving average of the NAAIM managers’ responses.
This week’s NAAIM Exposure Index number is: 34.33, coming off from its lowest level of the past 24 months recorded in the previous week.
Top Trading Ideas for the Week
$EE – Utilities
newly IPO-ed during the weakest phase of the market. 7 wks basing pattern within a 25% range from IPO price displays resilience in price action
traded to its ATH with two days of volume bids exceeding its avg and just merely $0.70 away from $30 pic.twitter.com/qx31jq3QTY
— Jeff Sun, CFTe (@jeffsuntrading) June 3, 2022
$AN remains in my WL for an entry position at $126.40. recaptured significant levels above VWAP from ATH and early april’s swing low. pic.twitter.com/ezTPjiRP96
— Jeff Sun, CFTe (@jeffsuntrading) May 30, 2022
$FNKO rebounded off its 50MA without further whipsaw that was displayed over the past year. VWAP from ATH coincides with the recent ER gap, acting as a cushion and a level to manage risk.
short term moving averages remains in inclination mode pic.twitter.com/Pa9bJtRSAF
— Jeff Sun, CFTe (@jeffsuntrading) May 30, 2022

