

The Nasdaq Composite index rose 8.1% last week, for its biggest weekly percentage gain since March, while the S&P 500 rose 5.9% and the Dow added 4.15%. The main catalyst for the relief rally was the October CPI report, which came in better than expected and much better than feared. But the Fed is unlikely to be swayed by a single inflation print, and past rebounds fueled by Fed-related optimism have crumbled this year after discouraging economic data or pushback from policymakers. Moreover, inverted yield confirms that such a relief rally isn’t sustainable.
In the coming week investors will be looking at a spate of U.S. data for further signs pointing to slow down in inflationary pressures, including Wednesday’s retail sales report. Furthermore, a slew of earnings results, particularly those from big retailers, including Home Depot ($HD), Walmart ($WMT), and Target ($TGT), will help investors gauge the health of the world’s largest economy. Fallout from the collapse of cryptocurrency exchange FTX will continue to reverberate through the crypto market. Meanwhile, economic data out of China will be in the spotlight after Beijing eased some of its strict pandemic restrictions on Friday, boosting hopes for an uptick in economic activity.
Here’s what you need to know to start your week.
1. Crypto turmoil
Concerns over the viability of the crypto ecosystem are continuing to swirl in the wake of the collapse of the crypto exchange FTX. FTX, which filed for bankruptcy on Friday, was engulfed in more chaos on Saturday when the exchange said it had detected unauthorized access and analysts said hundreds of millions of dollars of assets had been moved from the platform in “suspicious circumstances”. Rival exchange Binance stopped accepting deposits of FTX’s FTT token on its platform on Sunday and urged other exchanges to do the same.
Investors are now waiting to assess the extent of contagion within crypto markets, which have already taken a beating this year as central banks reverse pandemic-era monetary policy.
2. China data
China is to release October data on retail sales, industrial production, investment and employment on Tuesday with economists expecting the figures to reflect the ongoing impact of the government’s zero-COVID policy. Recent data showed exports and imports unexpectedly contracting, inflation slowing, new bank lending tumbling and property sales are in an extended decline. Beijing said Friday it was easing some of its COVID restrictions, including shortening quarantines by two days for close contacts of infected people and for inbound travelers. This comes despite cases on the mainland at 6-month highs and some big cities under fresh lockdowns.
Key Economic Calendar (Weekly)
Last week’s softer U.S. inflation data fueled expectations that the Fed will get less aggressive with rate hikes from December after four consecutive 75 basis point increases. Wednesday’s Retail Sales numbers for October should provide insight into how consumers are faring ahead of the key holiday shopping season amid historically high inflation.
Economists are expecting an increase of 0.9%. A stronger-than-expected reading could be seen as a sign the Fed still has more work to do in cooling the economy.
The U.S. is also to release October data on Producer Price Inflation (PPI), Empire State Manufacturing Index & Philly Fed Manufacturing Index.
All times listed are EST
Tuesday
8:30 US – Empire State Manufacturing Index: forecast to increase from -9.1 to -0.5
8:30 US – PPI m/m: forecast to increase from 0.45 to 0.5%
Wednesday
8:30 US – Core Retail Sales m/m: forecast to increase from 0.1% to 0.5%
8:30 US – Retail Sales m/m: forecast to increase from 0.0% to 0.9%
Thursday
8:30 US – Philly Fed Manufacturing Index: forecast to increase from -8.7 to -6.0
Top 3 Leading and Lagging Sectors (Weekly)
All 11 S&P 500 sectors logged a gain this week, none bigger than the information technology sector (+10.9%), which was driven by a huge comeback effort among the semiconductor stocks and by Apple ($AAPL) and Microsoft ($MSFT).
Other standouts included the communication services (+8.9%), materials (+8.1%), real estate (+6.6%), consumer discretionary (+6.2%), and financial (+5.4%) sectors. The weakest performer were the defensive-oriented utilities (+0.5%) sector.

Market Breath (Weekly)
% of Stocks Above 20 DMA =77.01% (+17.16%)
% of Stocks Above 50 DMA = 71.30% (+36.30%)
% of Stocks Above 200 DMA = 43.92% (+27.08%)


Market Technicals – (S&P 500, NASDAQ, Bitcoin, Bonds & Credit Spread, NAAIM)

$SPX (S&P 500) – (Net High/Low +88)
A hard landing for the economy was a prominent concern for market participants as the central banks ramped up their fight against inflation. It led to broad-based selling, rooted in worries that there will soon be large cuts to earnings estimates. Accordingly, there was a reticence to pay up for stocks and an inclination to take risk off the table. Worries about an economic downturn have hammered equities this year. The S&P 500 remains down -16.2% for the year to date, remaining on track for its largest annual decline since 2008.
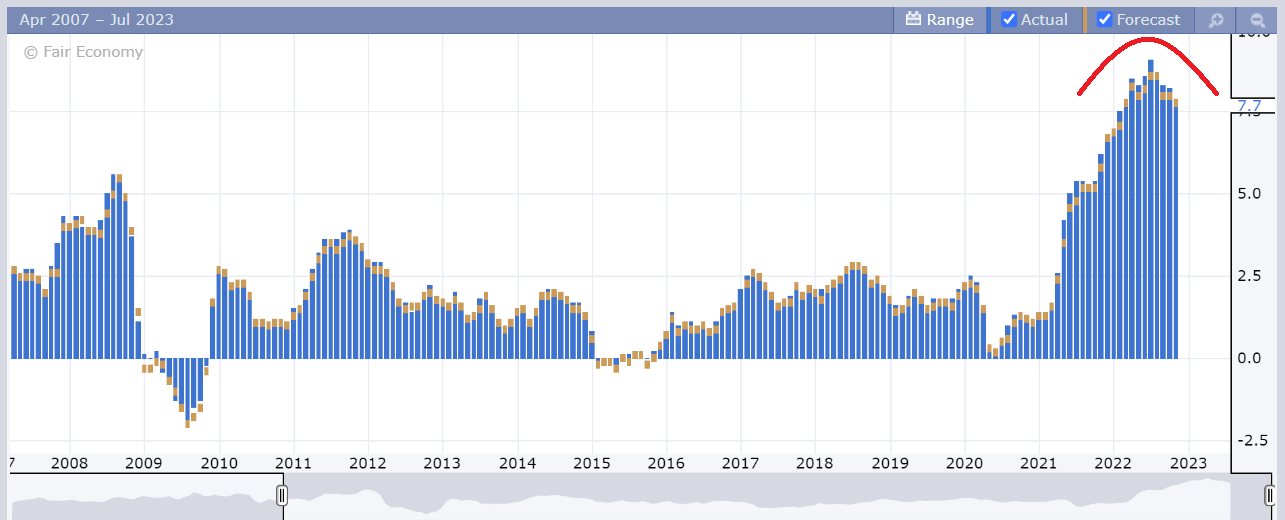
$SPX staged an aggressive rally of +5.9% after better-than expected CPI data, rebounding off its 10/20-day moving average, The huge gains were a manifestation of pent-up hope that inflation has peaked and that the ultra-aggressive nature of the Fed’s policy approach has also peaked. Briefly, total CPI increased 0.4% month-over-month in October while core-CPI, which excludes food and energy, increased 0.3% month-over-month. The monthly changes left total CPI up 7.7% year-over-year, versus 8.2% in September, and core CPI up 6.3% year-over-year, versus 6.6% in September.
The key takeaway from the report wasn’t singular. It was manifold: (1) The report helped validate the peak inflation view. (2) The report is apt to compel the Fed to take a less aggressive rate-hike approach at the December FOMC meeting. (3) Some encouragement was borne out of the understanding that the shelter index (computed with a lag) contributed more than half of the monthly all items increase, suggesting price increases moderated in many other areas.
$SPX currently trades inside a month long uptrend channel, below its medium term downtrend line. The resistance to reclaim for further positivity in the market is at 4,080, the current declining 200-day moving average level.
Bull Case: Reclaim above 4,080, the current declining 200-day moving average level.
Bear Case: Breakdown of 3,800 level, breaching its rising 10 & 20-day moving average. Next support at 3,700 level.

$QQQ (Nasdaq 100) – Similar Range Breakout From July 2022 May Be In Play
Tech and growth names have been hard hit since the start of 2022 by a rapid rise in Treasury yields on the back of expectations that the Fed will hike interest rates aggressively to combat high inflation as higher rates can hurt their companies with high valuations based on the prospect of future profits.
The tech-heavy $QQQ surged 8.84% last week, compared with the S&P 500’s 5.9% in its sharpest weekly rally of the year. This welcome inflation news, combined with a huge drop in the dollar and market rates, launched an epic rally. The $QQQ for its part soared 7.4% on Thursday alone, reclaiming its 10,20 & 50-day moving averages within the single session. Many of the beaten-up growth stocks made double-digit percentage moves, including Amazon. ($AMZN), but just about every stock came along for the CPI ride.
$QQQ have currently broke out of a consolidated 6 weeks range in similar fashion to to July 2022 period. During the time, $QQQ staged a continuous rally along its rising 10/20-day moving averages towards its medium term downtrend line.
The support level to watch for $QQQ this week is revised up to 270, undercutting its current 10/20-day moving averages.
Bull Case: Reclaim above 310 declining 20-day moving average.
Bear Case: Breakdown of 270 level, undercutting its current 10/20-day moving averages.. The next support level is at 260.

$BTCUSD (Bitcoin / USD) – A True Breakdown, But More Weakness Ahead
Bitcoin ($BTCUSD) tumbled -21.99% on its highest weekly volume since June 2022, affirming my bearish case of its price and volume contraction on weekly chart over the past five months. $BTCUSD remains languishing at the $16,000 level as $3 billion escaped crypto exchanges last week amid a bank run on fears of an FTX contagion.
The latest $BTCUSD daily action have morphed out a further Bearish Pennant pattern prompting the risk of a further accelerated sell off in near term remains.
The level of support to watch for $BTCUSD this week is revised lower to $15,630, a breakdown of the year to date low.
Bull Case: Recapturing last week losses and reclaim above $20,000.
Bear Case: Breakdown of $15,630, a year to date low.

$PCCE (Put/Call Ratio Equity) & $VIX (Volatility S&P 500) – Lowest $PCCE Print In 4 Months Violated Mid-Term Bearishness
VIX >30 is assumed to accompany large volatility, resulting from increased uncertainty, risk, and investor fear. VIX <20 generally correspond to stable, stress-free periods in the market. Higher VIX levels equates to more expensive options premium and vice versa for lower VIX level.
The spike level to watch for $PCCE in the last 24 months period is at 1.00. The current reading is 0.649 (-22.58%). This is the lowest print for $PCCE over the last 4 months, violating its year-long build up in momentum of a major sell off for the equities market.
Similarly, the VIX volatility index, also known as Wall Street’s fear gauge declined to 22.53 (-8.27%). Momentum in $VIX remains on track.
The earlier weekly build up in momentum of both $PCCE and $VIX was reflecting a major sell off remains imminent for the equities market.

$VIX/VXV – Reading at 0.86 (Tranquility)
The VIX/VXV measures the ratio between 1-month implied volatility and 3-month implied volatility, which is helpful as it filters out higher baseline readings on VIX.
- If it is greater than one, it implies uncertainty, negative for equities. On the contrary, such high reading (i.e. spikes) coincide with market bottoms.
- If it is less than one, it implies tranquility, favorable for equities.
- If it is below 0.82, the returns for S&P500 are often less than stellar.

$IEI/$HYG (Credit Spread) & $TNX (10YR Treasury Yield) – Aggressive Equity Rally Was a Relief Rally In An Inverted Yield Environment
Market participants are keeping a close watch on credit spreads as one of the better economic signals. Junk bond issuers are perceived to be bigger credit risks, so if economic growth slows or contracts, there will be increased angst that these issuers won’t be able to make good on their interest payments. Hence, a widening high-yield spread is regarded as a leading indicator of difficult economic times which, in turn, often invites a more challenging period for the stock market since difficult economic times translate into weaker earnings prospects.
Credit Spread lowered down to 1.54 (-0.01) for the week. The year to date high level is at 1.64 set in early July.
The welcome October inflation data dove the 10-yr note yield ($TNX) 44 basis points to 3.81%. The 2-yr note yield, which is sensitive to changes in the fed funds rate, plunged 36 basis points to 4.34%. Those moves were precipitated by changing rate-hike expectations. The fed funds futures market now sees an 83.0% probability of a 50-basis points rate hike at the December FOMC meeting (versus 56.8% before the CPI data) and a terminal rate of 4.75-5.00% by June (versus 5.00-5.25% before the CPI data).
The shift in rate-hike expectations is nothing new for this market, which has been desperate before to think the Fed is close to being done with its rate hikes only to be disappointed by subsequent data. The aggressive equity rally after better-than-expected CPI data could probably be deemed as a relief rally. Additionally, inverted yield confirms that it isn’t sustainable.

Courtesy of https://ycharts.com/indicators/naaim_number
NAAIM Exposure Index 53.33 (-3.42%)
The NAAIM Exposure Index represents the average exposure to US Equity markets reported by members of the National Association of Active Investment Managers. It provides insight into the actual adjustments active risk managers have made to client accounts over the past two weeks. The blue line depicts a two-week moving average of the NAAIM managers’ responses.
This week’s NAAIM Exposure Index number is: 53.33 (Wednesday)
Top Trading Ideas for the Week
$ESTE$RYTM$CAR$BTU pic.twitter.com/rTcrwTuNuQ
— Jeff Sun, CFTe (@jeffsuntrading) November 12, 2022

