
The S&P 500 fell 3.1% last week, which featured disappointing earnings from major retailers in a market which was already hard hit by worries over inflation, rising interest rates, geopolitical uncertainty stemming from the war in Ukraine, and the prospect of recession. The Nasdaq Composite underperformed with a 3.8% decline, followed by the Dow Jones Industrial Average (-2.9%) and Russell 2000 (-1.1%).
This week investors will be looking to Wednesday’s Federal Reserve meeting minutes for more insights on the central bank’s policy response to soaring inflation. Retail earnings will be in the spotlight again. U.S. data on personal income and spending – which contains the Fed’s favored measure of inflation – will be the highlight of the economic calendar.
Here’s what you need to know to start your week.
1. Fed minutes
Investors will be hoping that Wednesday’s Fed minutes can offer some clues about whether the U.S. central bank can curb the most aggressive inflation in four decades without tipping the economy into recession.
Fed Chair Jerome Powell is confident the central bank can achieve a “soft landing”, but Wall Street isn’t convinced the Fed can pull it off, with warnings over the prospect of a recession piling up.
Goldman Sachs strategists have predicted a 35% chance of the U.S. economy entering a recession in the next two years, while Wells Fargo analysts expect a mild U.S. recession at the end of 2022 and early 2023.
The Fed has already hiked interest rates by 75 basis points since March and markets are pricing in 50 basis point rate hikes in June and July.
Powell has vowed to raise rates as high as needed to tame inflation. The minutes will show how persistent policymakers expect inflation to be and whether the economy is resilient enough to face much tighter monetary policy.
2. Retail earnings
Investors will be bracing for earnings reports from Costco ($COST), Dollar General ($DG) and Best Buy ($BBY) in the coming week after disappointing results from big retailers last week hammered stocks, adding to fears over the outlook for the economy.
Walmart ($WMT), the nation’s largest retailer and rival Target ($TGT) reported that while store traffic was still strong, high inflation has started to erode the purchasing power of U.S. consumers.
Key Economic Calendar (Weekly)
The U.S. is to release April data on personal income and spending on Friday. The report also contains the Fed’s primary gauge of inflation, the core personal consumption expenditures price index. Economists are expecting the data to show that spending remained solid last month despite high inflation.
All times listed are EDT
Friday
8.30: US – Core PCE Price Index m/m: forecast to remain at 0.3%
Top 3 Leading and Lagging Sectors (Weekly)
7 of the 11 S&P 500 sectors closed lower with consumer staples (-8.7%) and consumer discretionary (-5..2%) sectors the weakest as high-profile retail companies Walmart ($WMT), Target ($TGT), and Ross Stores ($ROST) each cited sticky cost pressures for their disappointing results and cautious outlooks. Investors were concerned about the durability of the consumer in the high-cost environment.
Conversely, the basic materials (+2.2%), energy (+1.9%), and healthcare (+1.7%) sectors each ended the week in positive territory.

Market Breath (Weekly)
% of Stocks Above 50 DMA = 17.44% (-0.85%)
% of Stocks Above 200 DMA = 21.46% (-5.79%)

Market Technicals – (S&P 500, NASDAQ, Bitcoin, Bonds & Credit Spread, NAAIM)

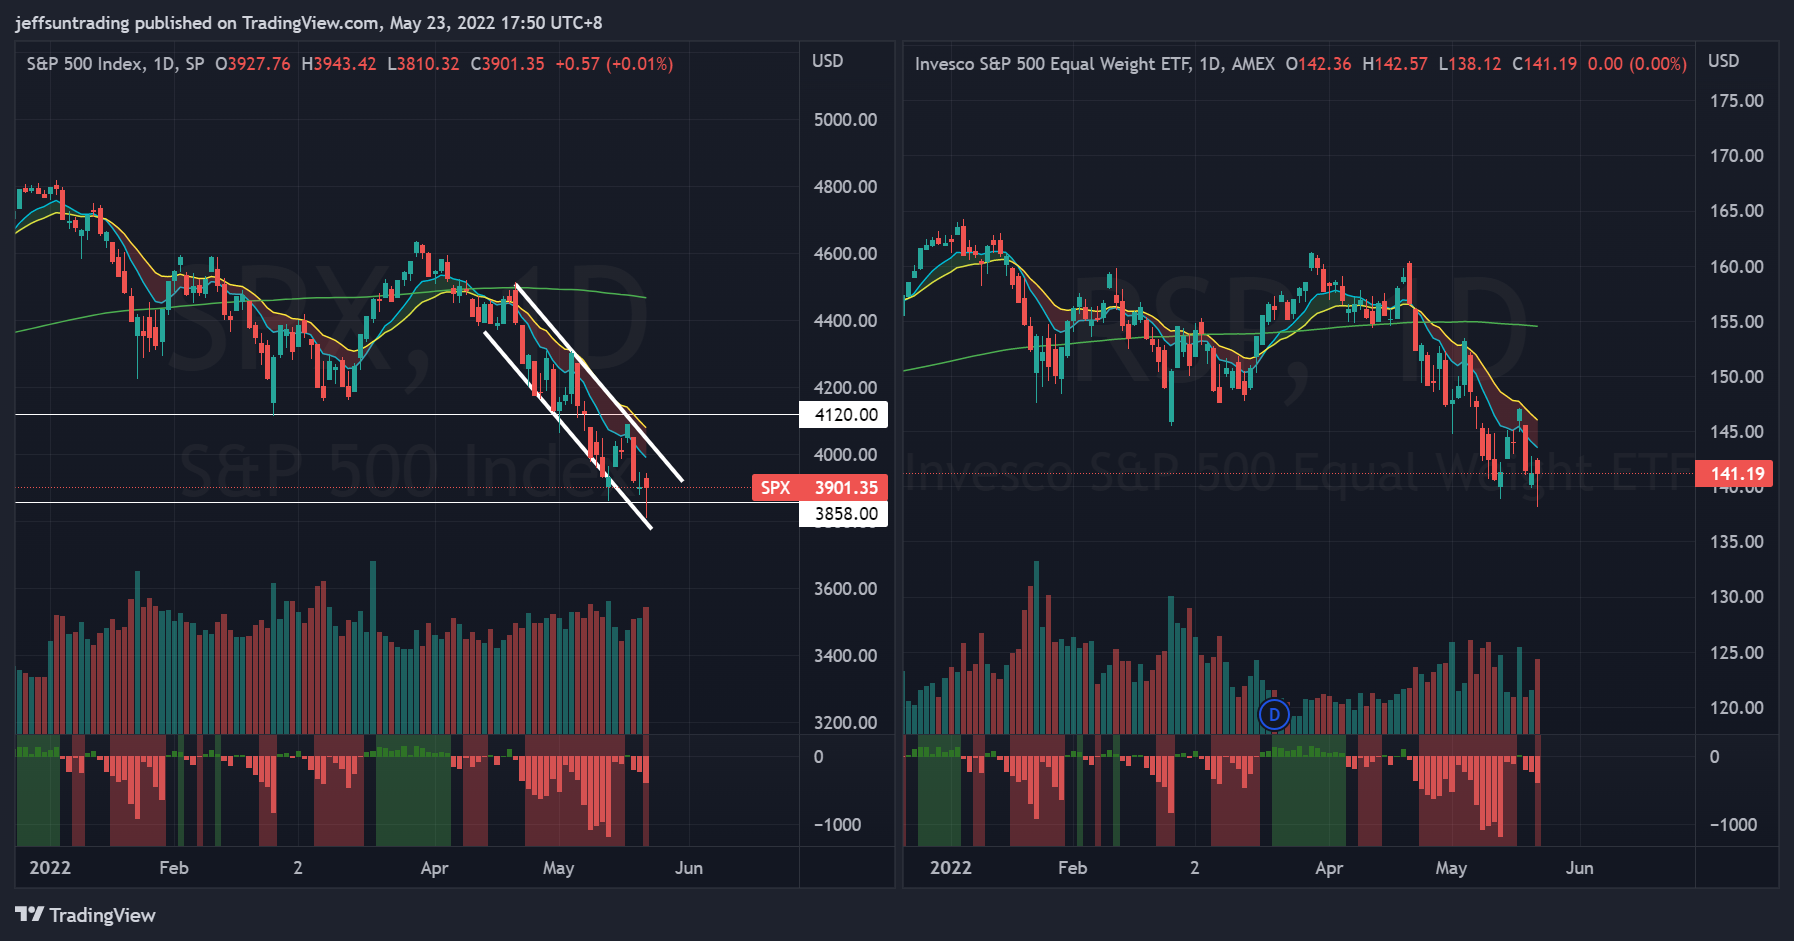
$SPX (S&P 500) vs $RSP (S&P 500 Equal Weight) – (Net High/Low -383)
U.S. stocks are on the threshold of a bear market – considered as a drop of at least 20% from a closing high. The S&P 500 ended Friday down 19% from its January 3 record closing high. Markets have been pressured lower by worries over surging inflation, a hawkish Fed and the outlook for economic growth. Adding to the selloff has been the war in Ukraine, which has added to spikes in oil and other commodity prices.
The S&P 500 ($SPX) fell -3.05% last week. $SPX remains trading below all of its major moving averages and have now morphed into a month long downtrend channel. $SPX posted its seventh straight weekly loss, while the Dow recorded its eighth consecutive weekly decline.
The immediate support to watch for this week remains at 3,858 level, the lowest level traded for the whole of 2022. Recapturing 4,120 would have $SPX breaking out of its downtrend channel, along with its declining short term moving averages (10-day and 20-day)

$QQQ (Nasdaq 100) vs $QQQE (Nasdaq 100 Equal Weight) – Trading Towards 2 Year Low
Tech and growth names have been hard hit since the start of 2022 by a rapid rise in Treasury yields on the back of expectations that the Fed will hike interest rates aggressively to combat high inflation as higher rates can hurt their companies with high valuations based on the prospect of future profits.
$QQQ fell -4.39% over the week, further setting a new lowest level year to date at $288. Similar to $SPX, $QQQ bearish momentum is also exhibited within its downtrend channel, along with its declining short term moving averages.
The support level to watch for $QQQ this week is at $280, the lowest level traded year to date.

$BTCUSD (Bitcoin / USD) – Bearish Head and Shoulder Pattern Remains In Play
Bitcoin ($BTCUSD) continues its weekly loss for the 7th consecutive week, falling -3.29% last week. It fell as much as -25% during the previous week, before recovering majority of that losses on Thursday (12th May). The session also marked Bitcoin’s highest trading volume session in 11 months. At the current juncture, the highlighted Bearish Head and Shoulder Pattern remains in play.
The next level of support to watch for $BTCUSD remains at $25,400, a breakdown of 12th May’s reversal.

$PCCE (Put/Call Ratio Equity) & $VIX (Volatility S&P 500) – $PCCE And $VIX Remains At Elevated Level For Caution
The spike level to watch for $PCCE in the last 24 months period is at 1.00. The current reading of 1.072 (+22.95%) implies a risk-off sentiment of the equity market. The critical level to watch for $PCCE is at 1.20 for further accelerated sell off in the equities market.
The CBOE Volatility index ($VIX), also known as Wall Street’s fear gauge, also creeped up to 29.42 (+1.94%), remaining at an elevated level for caution. While the index is elevated compared to its long-term average, it is still below levels reached in other major selloffs.

$IEI/$HYG (Credit Spread) – $TNX (10YR Treasury Yield) – Yield Nearing 4 Years High
Market participants are keeping a close watch on credit spreads as one of the better economic signals. Junk bond issuers are perceived to be bigger credit risks, so if economic growth slows or contracts, there will be increased angst that these issuers won’t be able to make good on their interest payments. Hence, a widening high-yield spread is regarded as a leading indicator of difficult economic times which, in turn, often invites a more challenging period for the stock market since difficult economic times translate into weaker earnings prospects.
Credit Spread creeped up further, sitting at 1.57% over the week (+0.01), the highest level in 14 months.
Meanwhile, the yield on the 2-yr note, which is most sensitive to changes in the fed funds rate, has further declined to 2.788% (-4.98%). Growth concerns, peak inflation hopes, and a general flight to safety contributed to increased demand for Treasuries, which drove yields lower in a curve-flattening trade this week. The 10-yr yield dropped 15 basis points to 2.79%. The stock market has not responded more favorably to that drop in rates because it recognizes that the drop in rates is a reflection of growth concerns.
Fed Chair Powell spoke on inflation last week, saying the Fed will be more aggressive with rate hikes if inflation doesn’t come down in a clear way, but that the Fed can be less aggressive if inflation does clearly come down.

NAAIM Exposure Index 19.51 (-4.80)
The NAAIM Exposure Index represents the average exposure to US Equity markets reported by members of the National Association of Active Investment Managers. It provides insight into the actual adjustments active risk managers have made to client accounts over the past two weeks. The blue line depicts a two-week moving average of the NAAIM managers’ responses.
This week’s NAAIM Exposure Index number is: 19.51, the lowest level of the past 24 months.
Top Trading Ideas for the Week
$RADI – Telecom Services
short term RS since its latest ER (reflected growth QoQ in both EPS and sales) during the first week of the month. cleared a double bottom base BO level at $15 and re-captured its 200MA on the last market session
now trading to its rising 10/20 MAs pic.twitter.com/jvSOOhn19R
— Jeff Sun, CFTe (@jeffsuntrading) May 23, 2022
$DK – Oil & Gas Refining & Marketing
taken out a 4 years DTL during march and currently challenging its 5 years pivot nearing its YTD high. RS since beginning of the year, relentless rising MAs.
latest ER reflects strong QoQ and quarterly growth for both EPS and Sales pic.twitter.com/KHmprUpunF
— Jeff Sun, CFTe (@jeffsuntrading) May 23, 2022