

The market rallied last week (S&P 500 +3.3% , Nasdaq +3.1%, Russell 200 +5.0%), with gains mostly broad based and secured entirely over two trading sessions (Wednesday and Friday). CPI July numbers on Wednesday did not move higher as had been feared, reflecting signs of disinflation. The same is also reflected on Thursday’s July PPI data. This triggered a huge upswing in the major indices, as investors relished the idea that inflation might have peaked and Fed might be able to temper the pace of its rate hikes for a soft landing.
The center stage for this week will be taken by the latest FOMC meeting minutes, which will be scrutinized for clues about the magnitude of upcoming rate hikes. Investors will get an update on U.S. retail sales along with earnings results from several major retailers, which will be parsed for insights into the strength of consumer spending amid elevated price pressures.
Here’s what you need to know to start your week.
1. Fed minutes
The Fed is to publish the minutes of its July meeting on Wednesday, which will be in the spotlight after economic data over the last two weeks boosted investors’ hopes that the central bank can pull off a soft landing for the economy.
A blowout jobs report for July eased fears over the prospect of recession, while last week’s inflation data pointed to the largest monthly slowdown in consumer price increases since 1973.
Traders are currently pricing in a less hawkish Fed, with fed fund futures showing a greater chance of officials raising rates by 50 basis points when they meet in late September, instead of 75 basis points as they have done at their last two meetings.
But Fed policymakers have pushed back on expectations for a dovish pivot, and economists have warned that inflation could return in the coming months.
2. Retail earnings
After a rocky start to the year, which saw the S&P 500 tumble -20% in the first half, stronger-than-forecast second-quarter earnings have helped bolster U.S. equities.
Walmart ($WMT) and Home Depot ($HD) are due to report second quarter earnings on Tuesday, followed a day later by Target ($TGT) and Lowe’s ($LOW), with investors eager to hear what the largest U.S. retailers have to say about rising price pressures and ongoing supply chain issues.
Both Walmart and Target have recently cut forecasts and warned inflation was squeezing margins and forcing consumers to cut back on discretionary purchases.
Retailers’ outlook on consumer spending will be important for investors looking to assess the pace of inflation.
Key Economic Calendar (Weekly)
The U.S. is to release July retail sales figures on Wednesday which will be watched for indications on the strength of consumer spending after a slowdown in second quarter growth. Economists are expecting an increase of just 0.1% after a gain of 1.0% the previous month, with falling gasoline prices accounting for some of the slowdown.
All times listed are EDT
Wednesday
8:30: US – Core Retail Sales m/m: forecast to decline to 0.1% from 1.0%
14.00: US – FOMC Meeting Minutes
Top 3 Leading and Lagging Sectors (Weekly)
All 11 S&P 500 sectors closed higher for the week. Gains ranged from 1.2% (healthcare) to 5.9% (energy). Cyclical sectors saw some of the biggest gains and value stocks outlegged growth stocks in a move that showed reduced fears about the economy suffering a hard landing.

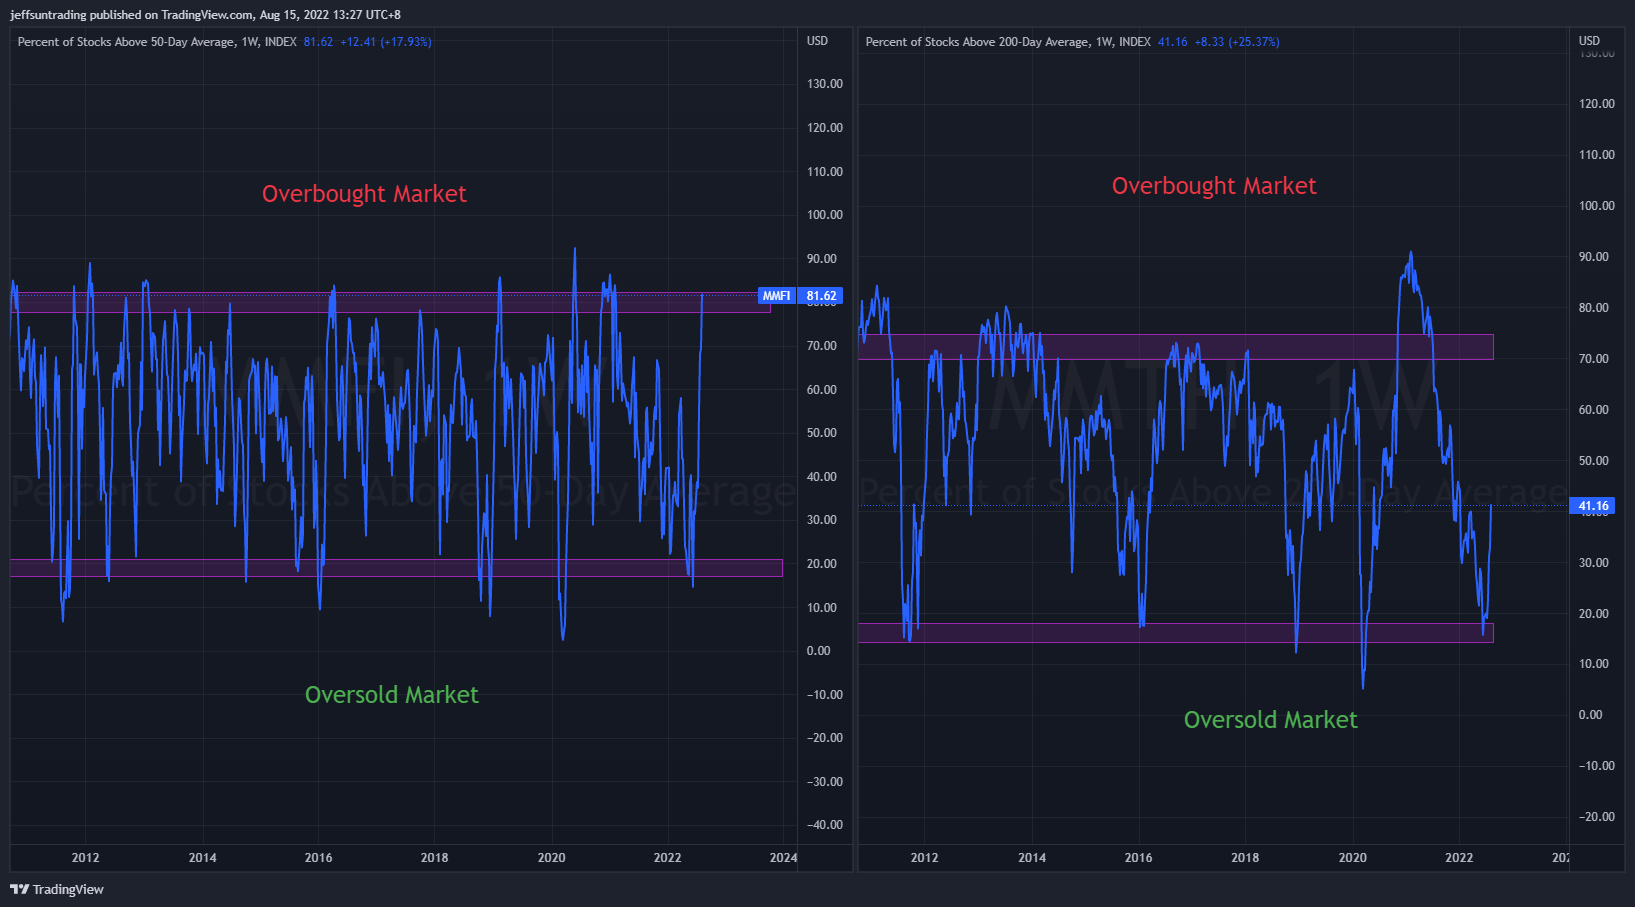
Market Breath (Weekly)
% of Stocks Above 50 DMA = 81.62% (+17.93%)
% of Stocks Above 200 DMA = 41.16% (+25.37%)

Market Technicals – (S&P 500, NASDAQ, Bitcoin, Bonds & Credit Spread, NAAIM)

$SPX (S&P 500) vs $RSP (S&P 500 Equal Weight) – (Net High/Low +138)
$SPX scored its fourth straight weekly advance (+3.26%) last week, and crossed an important level 4,200 that is interpreted as a telltale signal that the low in June was the low for the bear market. That level marked a 50% retracement of the losses suffered between the January 3 closing level (4,796.56) and the June 16 closing level (3,666.77).
The rally also see $SPX penetrating above its VWAP from all time high on Friday, as the major indices all went out on a high note in a grinding rally effort on Friday which was impressively resilient.
At the current juncture, $SPX is running towards a confluence of resistance which includes
- its declining 200MA,
- trend channel resistance,
- major support turned resistance all within 4,300 – 4,350 range, and
- extension in % of stocks above 20MA and 50MA at their extreme levels
The support to watch for this week is at 4,200 level, the immediate resistance turned support level which also slices through its current declining all time high VWAP level.

$QQQ (Nasdaq 100) vs $QQQE (Nasdaq 100 Equal Weight) – Short Term Bearish Rising Wedge Observed
Tech and growth names have been hard hit since the start of 2022 by a rapid rise in Treasury yields on the back of expectations that the Fed will hike interest rates aggressively to combat high inflation as higher rates can hurt their companies with high valuations based on the prospect of future profits.
$QQQ remains as the weakest major index year to date with -16.6% return, but the gap in the year to date correction between the major indices has been tightening since the beginning of July 2022. $QQQ posted a weekly gain of +2.69% for the week, affirming its relative strength against $SPX since 25th May as it continues to play out its month long Bullish Ascending Triangle pattern that was highlighted last month.
At the current juncture, $QQQ is morphing out a month long bearish rising wedge pattern.
The support level to watch for $QQQ this week is at $315, an immediate resistance turned support level that would also slice through the existing rising 10/20-day moving averages.

$BTCUSD (Bitcoin / USD) – Second Bearish Flag Formation For Bitcoin
Bitcoin ($BTCUSD +4.88%) second successive bearish flag formation remains in play, as it continues to shape up a relatively calm end to another week and that may not be good news for Bitcoin in the long term.
Unless the price doesn’t decisively break the $25,000 resistance soon, more holders are expected to abandon their position, causing a breakdown and triggering a move back to the June 18 lows in the $17,000s, resuming the long-term downtrend.
The level of support to watch for $BTCUSD this week is at $22,500, a minor support level that would slice through the existing flatten 10/20-day moving averages, before a year-till-date support low breakdown.

$PCCE (Put/Call Ratio Equity) & $VIX (Volatility S&P 500) – Persistence in Reflection of Imminent Major Sell Off Ahead
VIX >30 is assumed to accompany large volatility, resulting from increased uncertainty, risk, and investor fear. VIX <20 generally correspond to stable, stress-free periods in the market. Higher VIX levels equates to more expensive options premium and vice versa for lower VIX level.
The spike level to watch for $PCCE in the last 24 months period is at 1.00. The current reading of 0.759 (-2.81%) remains elevated and poses likelihood and risk of accelerated selling for the month of August.
Similarly, the CBOE Volatility index ($VIX), also known as Wall Street’s fear gauge, declined to 19.52 (-7.66%).
The weekly build up in momentum of both $PCCE and $VIX is reflecting a major sell off remains imminent for the equities market ahead.

$IEI/$HYG (Credit Spread) – $TNX (10YR Treasury Yield) – Treasury Market Not In Agreement With Stock Market Rally
Market participants are keeping a close watch on credit spreads as one of the better economic signals. Junk bond issuers are perceived to be bigger credit risks, so if economic growth slows or contracts, there will be increased angst that these issuers won’t be able to make good on their interest payments. Hence, a widening high-yield spread is regarded as a leading indicator of difficult economic times which, in turn, often invites a more challenging period for the stock market since difficult economic times translate into weaker earnings prospects.
Credit Spread further edge down to 1.52% (-0.01) after setting a high of 1.62% at the end of June, the highest spread level since November 2020.
The Treasury market wasn’t as convinced of that point as the stock market seemed to be. The 2-yr note yield, which is sensitive to changes in the fed funds rate, ended the week up two basis points at 3.25%, virtually unchanged from where it was when the CPI report was released on last Wednesday. The 10-yr note yield settled the week up one basis point at 2.84%, up about five basis points from where it was trading before the release of the CPI report.

NAAIM Exposure Index 71.59 (+29.50%)
The NAAIM Exposure Index represents the average exposure to US Equity markets reported by members of the National Association of Active Investment Managers. It provides insight into the actual adjustments active risk managers have made to client accounts over the past two weeks. The blue line depicts a two-week moving average of the NAAIM managers’ responses.
This week’s NAAIM Exposure Index number is: 71.59
Top Trading Ideas for the Week
$PAYO – Tech | Software Infra
RS, basing & whipsawing around its 10/20/50 MAs for over 6 months. begun trading directionally since July ahead of its ER
strong beat in Friday’s ER have it trading above its 200MA for the 1st since 09/2021 on high vol, a sign of character change pic.twitter.com/LUFSag9rrw
— Jeff Sun, CFTe (@jeffsuntrading) August 15, 2022
$TOST – Tech | Software Infra (another tech as the sector is leading in 1&3 mths RS)
traded out of a 6mths bullish falling wedge to rising 10/20 MAs and RS. pre-Fri’s ER posted strongest ever quarterly sales. Fri traded as much as +19% intraday
ATH VWAP is a key pivot level now pic.twitter.com/tfS1WOt7k2
— Jeff Sun, CFTe (@jeffsuntrading) August 15, 2022
$AN – Auto & Truck Dealerships
after 6 mths, $AN still remains in my actionable watchlist at $126.45. the prolonged period of consolidation from its ATH in Oct’21 turned this into a very attractive position trade proposition.
price tightening into triangle range since April pic.twitter.com/CHoZxsmMLJ
— Jeff Sun, CFTe (@jeffsuntrading) August 15, 2022

