

After a week that saw financial markets rocked as central banks and governments ramped up their fight against inflation, the Wall Street’s main indexes suffered another week of heavy losses. S&P posted a 4.6% decline last week, and is down 6.6% for the month while Nasdaq declined 5.1% last week and is down 8.0% for the month. The Dow Jones Industrial Average fell 4.0% and is down 6.1% for the month.
Investors will be bracing themselves for fresh volatility this week. The highlight of the U.S. economic calendar will be Friday’s data on personal income and spending, which includes the Fed’s favored inflation gauge.
Here’s what you need to know to start your week.
1. Stock selloff
The Federal Reserve released their latest interest rate decision last week and decided to raise interest rates by 75 basis points; increasing the federal funds rate range to 3%–3.25%, and indicated it will keep hiking well above the current level.
This has caused a rout in bond markets and it added pressure on stocks as investors recalibrated their portfolios to a world of persistent inflation and rising interest rates.
As well as tightening financial conditions around the world, market sentiment has been hard hit by a range of other issues including the Ukraine conflict, the energy crisis in Europe and China’s COVID-19 flare-ups.
Key Economic Calendar (Weekly)
The highlight of the economic calendar will be August data on personal income and expenditure on Friday which includes the Personal Consumption Expenditures Price Index, the Fed’s preferred inflation measure.
Economists are expecting the annualized increase in the PCE price index to moderate because of recent declines in fuel costs, but the core PCE price gauge that excludes food and energy is expected to increase.
All times listed are EDT
Tuesday
10:00 US – CB Consumer Confidence m/m: forecast to increase from 103.2 to 104.0.
Friday
8:30 US – Core PCE Price Index m/m: forecast to increase from 0.1% to 0.5%
Top 3 Leading and Lagging Sectors (Weekly)
All 11 S&P 500 sectors registered continual losses last week ranging from -2.7% (consumer staples) to -9.1% (energy).

Market Breath (Weekly)
% of Stocks Above 20 DMA = 7.31% (-68.04%)
% of Stocks Above 50 DMA = 11.78% (-62.54%)
% of Stocks Above 200 DMA = 16.84% (-37.28%)


Market Technicals – (S&P 500, NASDAQ, Bitcoin, Bonds & Credit Spread, NAAIM)

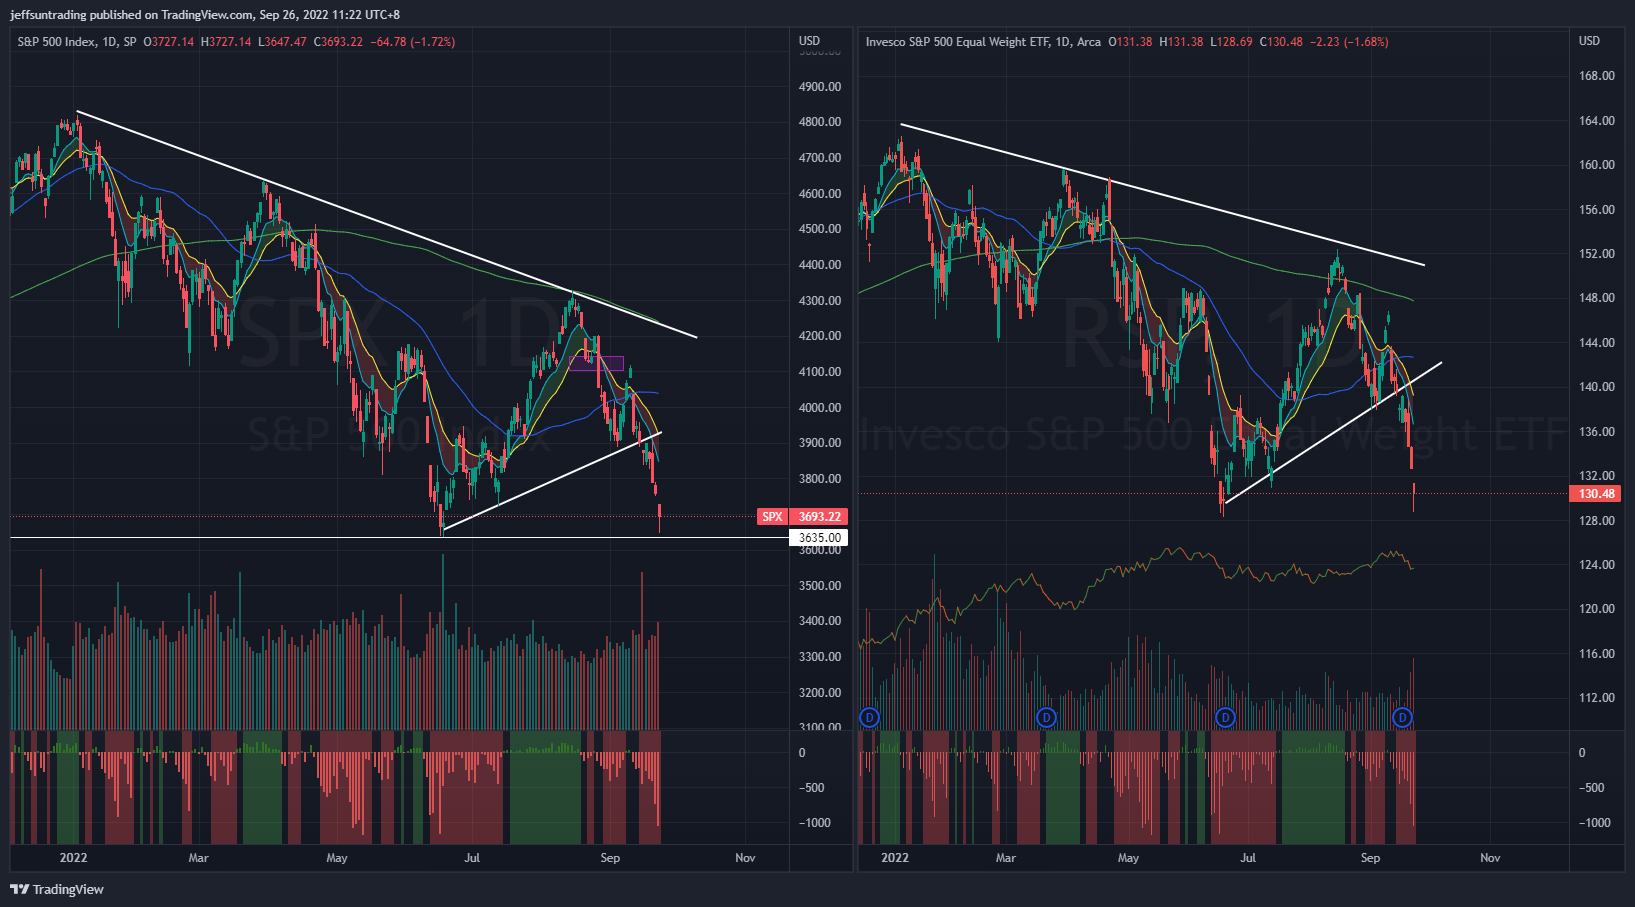
$SPX (S&P 500) vs $RSP (S&P 500 Equal Weight) – (Net High/Low -1,037)
The month of September has been the worst-performing month of the year historically for the stock market. Unfortunately, it is living up to that historical reputation this September. Following a 4.6% decline last week, the S&P 500 is down 6.6% for the month.
A hard landing for the economy was a prominent concern for market participants as the central banks ramped up their fight against inflation. It led to broad-based selling, rooted in worries that there will soon be large cuts to earnings estimates. Accordingly, there was a reticence to pay up for stocks and an inclination to take risk off the table.
At the current juncture, $SPX is trading near its year to date low.
The support to watch for this week is at 3,635 level, a breakdown of the lowest level of the year.
Bull Case: Reclaim above 4,045 50-day moving average level.
Bear Case: Breakdown of 3,635 year to date low. next support at 3,540 level.

$QQQ (Nasdaq 100) vs $QQQE (Nasdaq 100 Equal Weight) – Seasonal Headwind Suggested By 10 Years Data
Tech and growth names have been hard hit since the start of 2022 by a rapid rise in Treasury yields on the back of expectations that the Fed will hike interest rates aggressively to combat high inflation as higher rates can hurt their companies with high valuations based on the prospect of future profits.
$QQQ declined -4.6% for the week, remaining as the weakest major index year to date with -30.5% return.
It is worth to note that based on the past 10 years data, $QQQ has declined by an average of -0.6% in September—the only month of the year with a negative return.
The support level to watch for $QQQ this week is at 268 level, the lowest level of the year.
Bull Case: Reclaim above 307 50-day moving average.
Bear Case: Breakdown of 268, the year to date low. The next support level is at 260.

$BTCUSD (Bitcoin / USD) – Bearish Pennant Forming Below 10/20-Day Moving Average
Bitcoin posted second consecutive week of losses with a -3.14% loss for last week. $BTCUSD remains below its declining 10 & 20 day-moving average. Similarly, long term moving averages such as 200-day and 50-day are all in declining fashion.
$BTCUSD is currently morphing out a Bearish Pennant pattern, a consolidated price action behavior that may prompt a further sell off in near term.
The level of support to watch for $BTCUSD this week is at $18,157, the lowest level of the month before reaching its year till date low $17,590.
Bull Case: Reclaim above its existing 50-day moving averages at $21,000.
Bear Case: Breakdown of $18,157, a immediate support before reaching its year till date low $17,590.

$PCCE (Put/Call Ratio Equity) & $VIX (Volatility S&P 500) – Persistence in Reflection of Imminent Major Sell Off Ahead
VIX >30 is assumed to accompany large volatility, resulting from increased uncertainty, risk, and investor fear. VIX <20 generally correspond to stable, stress-free periods in the market. Higher VIX levels equates to more expensive options premium and vice versa for lower VIX level.
The spike level to watch for $PCCE in the last 24 months period is at 1.00. The current reading of 1.293 (+7.07%) is the highest reading since June and it poses likelihood and risk of further accelerated selling for the month of September.
Likewise, the VIX volatility index, also known as Wall Street’s fear gauge rise to 29.91 (+13.68%).
The weekly build up in momentum of both $PCCE and $VIX is reflecting a major sell off remains imminent for the equities market ahead.

$VIX/VXV – Reading at 1.06 (Uncertainty)
The VIX/VXV measures the ratio between 1-month implied volatility and 3-month implied volatility, which is helpful as it filters out higher baseline readings on VIX.
- If it is greater than one, it implies uncertainty, negative for equities. On the contrary, such high reading (i.e. spikes) coincide with market bottoms.
- If it is less than one, it implies tranquility, favorable for equities.
- If it is below 0.82, the returns for S&P500 are often less than stellar.

$IEI/$HYG (Credit Spread) – $TNX (10YR Treasury Yield) – 10-Year US Treasuries Yield On Track For Year Till Date High
Market participants are keeping a close watch on credit spreads as one of the better economic signals. Junk bond issuers are perceived to be bigger credit risks, so if economic growth slows or contracts, there will be increased angst that these issuers won’t be able to make good on their interest payments. Hence, a widening high-yield spread is regarded as a leading indicator of difficult economic times which, in turn, often invites a more challenging period for the stock market since difficult economic times translate into weaker earnings prospects.
Credit Spread inched up further to 1.59% (+0.02) for the week. The year to date high level is at 1.64%, set in early July.
The 2-yr note yield spiked 36 basis points to 4.21% (having hit 4.26% at its high of the week) and the 10-yr note yield ($TNX) surged 25 basis points to 3.70% (having hit 3.82% at its high of the week).

NAAIM Exposure Index 29.59 (-12.61%)
The NAAIM Exposure Index represents the average exposure to US Equity markets reported by members of the National Association of Active Investment Managers. It provides insight into the actual adjustments active risk managers have made to client accounts over the past two weeks. The blue line depicts a two-week moving average of the NAAIM managers’ responses.
This week’s NAAIM Exposure Index number is: 29.59 (Wednesday)
Top Trading Ideas for the Week
$POSH$IS$PINS$FUBO#Trading #MomentumLeaders #RelativeStrength pic.twitter.com/JQ6ViZUZF0
— Jeff Sun, CFTe (@jeffsuntrading) September 26, 2022