

Wall Street closed sharply higher on Friday with the S&P500 (+4.0%) and the Nasdaq (+2.2%) posting their second straight weekly gain and the Dow (+5.7%) notching up its fourth consecutive weekly gain boosted by hopes for a Fed pivot. Small cap stocks were a specific pocket of strength this week. The Russell 2000 gained 6.0%, which was more than the three major averages.
The Federal Reserve and the Bank of England are all but certain to deliver jumbo 75-basis-point rate hikes on Wednesday and Thursday, respectively, as the battle against sky-high inflation continues. But with investors now on the lookout for signs that aggressive monetary tightening could start to slow, Friday’s U.S. jobs report for October will be in the spotlight. And with earnings season at the halfway mark the week ahead will show whether U.S. equities can continue to take disappointing corporate results in stride.
Here’s what you need to know to start your week.
1. Earnings
With earnings season passing the halfway mark the week ahead will be a test of whether equities can continue to weather disappointing earnings news. Healthcare, consumer discretionary, energy, and car manufacturer stocks will report this week.
263 of the companies in the S&P 500 have already reported and more than 150 S&P 500 companies are due to report quarterly results in the coming week, including Eli Lilly ($LLY), ConocoPhillips ($COP) and Qualcomm ($QCOM).
Earnings season has seen high-profile misses from some big tech names including Amazon ($AMZN), Microsoft ($MSFT), Google parent Alphabet ($GOOGL) and Facebook parent Meta Platforms ($META).
Key Economic Calendar (Weekly)
Next week’s FOMC decision is widely expected to be an unanimous vote for one last major rate increase in December. With the Fed’s preferred price measure still showing inflation is running hot, that might make it harder for them to set up a possible downshift in its rate-hike pace for the December meeting. Despite an acceleration with inflation, strong consumer spending data, and a robust labor market, much of Wall Street is growing confident that the Fed will pause tightening once they take the funds rate to 4.50-4.75% next quarter.
In addition to the FOMC decision, investors will also closely monitor the nonfarm payroll report. The strong labor market is still expected to show job growth with 200,000 jobs created in October, down from the 263,000 created in the prior month. The unemployment rate is expected to tick higher and wage gains are expected to slow.
All times listed are EDT
Tuesday
10:00 US – ISM Manufacturing PMI: forecast to decline from 50.9 to 50.0
10:00 US – JOLTS Job Openings: forecast to decline from 10.05M to 9.75M
Wednesday
8:15 US – ADP Non-Farm Employment Change: forecast to decline from 208k to 200k
14:00 US – FOMC Statement: Federal Fund Rate to increase by 75 basis point
Thursday
10:00 US – ISM Services PMI: forecast to decline from 56.7 to 55.5
Friday
8:30 US – Non-Farm Employment Change: forecast to decline from 263k to 200k, unemployment rate to increase from 3.5% to 3.6%
Top 3 Leading and Lagging Sectors (Weekly)
Real estate was the top performer this week with a gain of 6.44%. Utilities, Consumer Defensive, Industrials, Financial and Healthcare all presented notable gains exceeding 5%. Communication Services were the only loser as the losses incurred by Meta Platforms ($FB) and Alphabet ($GOOGL) drove the communication services sector to close down -2.1%.

Market Breath (Weekly)
% of Stocks Above 20 DMA = 77.61% (+30.20%)
% of Stocks Above 50 DMA = 55.51% (+72.55%)
% of Stocks Above 200 DMA = 35.70% (+33.16%)


Market Technicals – (S&P 500, NASDAQ, Bitcoin, Bonds & Credit Spread, NAAIM)

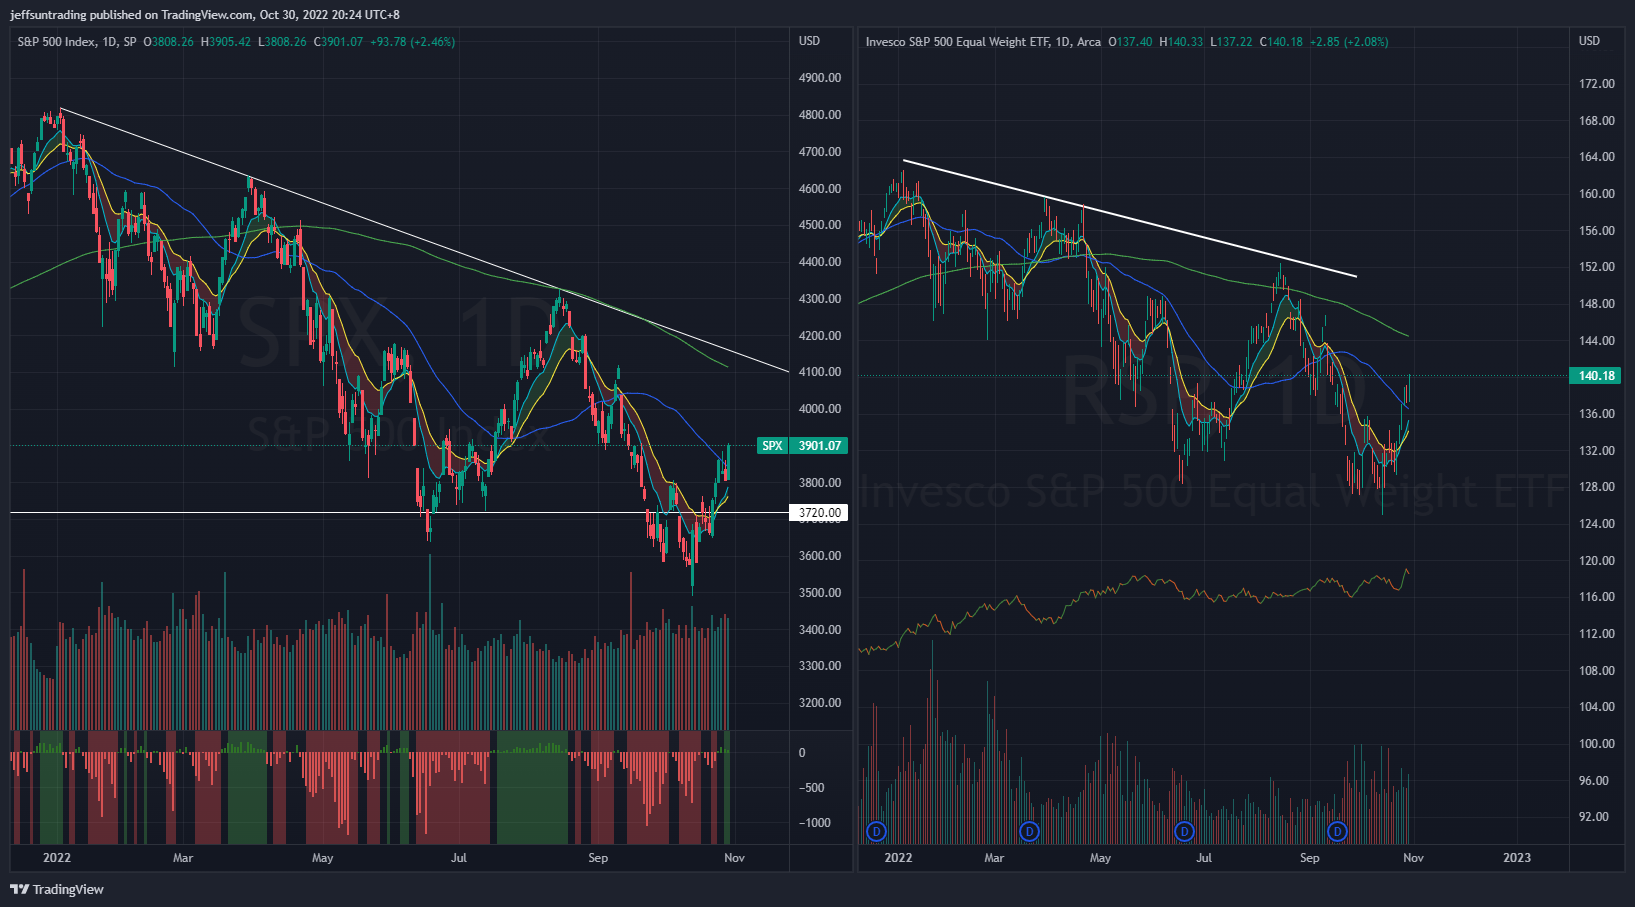
$SPX (S&P 500) vs $RSP (S&P 500 Equal Weight) – (Net High/Low 33)
A hard landing for the economy was a prominent concern for market participants as the central banks ramped up their fight against inflation. It led to broad-based selling, rooted in worries that there will soon be large cuts to earnings estimates. Accordingly, there was a reticence to pay up for stocks and an inclination to take risk off the table.
$SPX posted its second consecutive week of gain (+3.95%), reclaiming its 50-day moving average (declining) during the week. $SPX is currently 5.6% away from recapturing its 200-day moving average.
There is a growing belief among market participants that the Fed will soften its approach after the November meeting. The policy move from the Bank of Canada this week further fueled this notion. The Bank of Canada raised its key policy rate by 50 basis points versus an expected 75 basis points. The European Central Bank, however, delivered a 75 basis point increase for its key policy rates, as expected.
Market participants digested a slew of economic data this week that both supported and undermined the notion that the Fed will soften its approach soon. Some of the data releases included:
- September PCE Prices 0.3%
- The key takeaway from the report is that with continued income growth and a slightly hotter than expected Core PCE price growth, the Fed has an argument to maintain its aggressive rate hike course.
- Weekly Initial Claims 217K
- The key takeaway from the report is that the initial claims data suggest the labor market continues to hold up well, which of course is something that will continue to draw the Fed’s attention.
- Q3 GDP-Adv. 2.6%
- The key takeaway from the report is that it ends a two-quarter streak of negative GDP prints. It also suggests the economy held up well in the third quarter as it started to acclimate to rising interest rates. Real final sales of domestic product, which excludes the change in private inventories, increased a solid 3.3%.
- October Consumer Confidence 102.5
- The key takeaway from the report is that consumers’ concerns about inflation picked up again in October on the back of rising gas and food prices.
Falling Treasury yields were also a big support factor for the stock market rally during the week.
The support to watch for this week is revised up to 3,720 level, a beach of $SPX rising 10 & 20-day moving average.
Bull Case: Reclaim above 4,110, 200-day moving average level.
Bear Case: Breakdown of 3,720 level, beaching its rising 10 & 20-day moving average. Next support at 3,490 level.

$QQQ (Nasdaq 100) vs $QQQE (Nasdaq 100 Equal Weight) – Higher Treasury Yields To Continue Painful Transition For Stocks
Tech and growth names have been hard hit since the start of 2022 by a rapid rise in Treasury yields on the back of expectations that the Fed will hike interest rates aggressively to combat high inflation as higher rates can hurt their companies with high valuations based on the prospect of future profits.
$QQQ grinded out as the smallest gainer (+2.11%) for the week, as $SPX, $DJI and $RUT posted weekly gains exceeding 4% respectively. $QQQ was laggard as mega cap stocks, which have been looked at for so long as highly robust, fell off sharply as earnings news rolled in this week. Apple ($AAPL) was a rare exception among the tech giants, trading up after reporting quarterly results. Meta Platforms ($META), Alphabet ($GOOG), Microsoft ($MSFT), and Amazon ($AMZN) all suffered heavy losses on the heels of their respective earnings reports.
$QQQ remains as the weakest major index year to date with -29.0% return. It also the only remaining index that have yet to reclaimed its 50-day moving average.
The support level to watch for $QQQ this week is revised up to 267 level, a classical support, along with a breach of 10/20-day moving averages
Bull Case: Reclaim above 288 50-day moving average.
Bear Case: Breakdown of 267 level, a classical support, along with a breach of 10/20-day moving averages. The next support level is at 254.

$BTCUSD (Bitcoin / USD) – Price and Volume Contraction On Weekly Chart Continue to Reflect Bearishness
Bitcoin ($BTCUSD) posted a substantial gain of of +5.38% for the week, successfully reclaiming three of its key moving averages during week (10, 20, and 50-day moving averages).
$BTCUSD’s Bearish Pennant pattern is violated but with price consolidation and volume contraction remaining in its weekly chart, a longer term Bearish Flag channel is now morphed out, prompting the risk of a a further accelerated sell off in near term remains.
The level of support to watch for $BTCUSD this week is revised up to $18,800, a level that undercuts the existing three key moving average that was recaptured.
Bull Case: Violation of existing Bearish Flag channel at $22,000.
Bear Case: Breakdown of $18,800, a level that undercuts the existing three key moving average that was recaptured. Next support level at $18,157.

$PCCE (Put/Call Ratio Equity) & $VIX (Volatility S&P 500) – Persistence in Reflection of Imminent Major Sell Off Ahead
VIX >30 is assumed to accompany large volatility, resulting from increased uncertainty, risk, and investor fear. VIX <20 generally correspond to stable, stress-free periods in the market. Higher VIX levels equates to more expensive options premium and vice versa for lower VIX level.
The spike level to watch for $PCCE in the last 24 months period is at 1.00. The current reading is 0.862 (+4.43%).
Conversely, the VIX volatility index, also known as Wall Street’s fear gauge declined to 25.75 (-13.24%).
The weekly build up in momentum of both $PCCE and $VIX is reflecting a major sell off remains imminent for the equities market ahead.

$VIX/VXV – Reading at 0.91 (Tranquility)
The VIX/VXV measures the ratio between 1-month implied volatility and 3-month implied volatility, which is helpful as it filters out higher baseline readings on VIX.
- If it is greater than one, it implies uncertainty, negative for equities. On the contrary, such high reading (i.e. spikes) coincide with market bottoms.
- If it is less than one, it implies tranquility, favorable for equities.
- If it is below 0.82, the returns for S&P500 are often less than stellar.

$IEI/$HYG (Credit Spread) & $TNX (10YR Treasury Yield) – 10-Year US Treasuries Yield On Track For Year Till Date High
Market participants are keeping a close watch on credit spreads as one of the better economic signals. Junk bond issuers are perceived to be bigger credit risks, so if economic growth slows or contracts, there will be increased angst that these issuers won’t be able to make good on their interest payments. Hence, a widening high-yield spread is regarded as a leading indicator of difficult economic times which, in turn, often invites a more challenging period for the stock market since difficult economic times translate into weaker earnings prospects.
Credit Spread further reduced to 1.53 (-0.03) for the week. The year to date high level is at 1.64 set in early July.
Falling Treasury yields were a big support factor for the stock market. The 10-yr Treasury note yield ($TNX) dipped below 4.00%, but ultimately settled the week down 20 basis points at 4.01%. The 2-yr note yield fell nine basis points to 4.42%.

NAAIM Exposure Index 53.91 (+24.56%)
The NAAIM Exposure Index represents the average exposure to US Equity markets reported by members of the National Association of Active Investment Managers. It provides insight into the actual adjustments active risk managers have made to client accounts over the past two weeks. The blue line depicts a two-week moving average of the NAAIM managers’ responses.
This week’s NAAIM Exposure Index number is: 53.91 (Wednesday)
Top Trading Ideas for the Week
$LXU$GENI$MIR$RYTM pic.twitter.com/GoylAZuU5P
— Jeff Sun, CFTe (@jeffsuntrading) October 30, 2022
Do follow me on twitter for more daily trading ideas.

