

Headlines that reinforced a slower growth environment were persistent last week but it traded through the growth worries to record a winning week as the Nasdaq Composite close the week with gains of +3.3% and +2.5%, respectively, while the Russell 2000, and Dow Jones Industrial Average gained +3.6%, and +2.0%. The stock market behaved as if the bad economic news and more challenging earnings environment heard throughout the week was not a surprise.
This week will be the busiest week of summer in the US with the Fed decision, Q2 GDP growth rate, and earnings reports for more than a third of S&P 500 companies including Apple, Microsoft, Google, Facebook and Amazon taking center stage.
Here’s what you need to know to start your week.
1. Federal Reserve Meeting
Inflation reports have remained elevated, and that’s led just about all market prognosticators to expect at least a 75 basis points hike from the Federal Reserve.
The FOMC statement and Fed Chair Powell’s press conference will be in some ways more needle moving for the market, as the market tries to size the possibility of a recession and how committed the Fed will be to taming inflation if that recession shows up. With talk already of rate cuts coming next year, the phrase ‘threading the needle’ is sure to come up a few times this week.
2. Big Tech Earnings
The biggest companies in the world report earnings this week, and many of them are from the recently beaten down technology sector.
Starting Tuesday, Microsoft ($MSFT) and Alphabet ($:GOOGL) reports after the bell. Alphabet is especially on watch after the initial tremors from the digital advertising space that Snap and Twitter set off, and given the company does not provide guidance. Whether their 25% drop year to date means bad news is priced in remains to be seen.
Facebook ($META) parent Meta Platforms reports on Wednesday after market hours and has been upfront about its big investment plans for the year and the challenges it faces from Tik Tok and pandemic-related comparisons, which has seen the stock drop 50% year to date as a result. Whether they are seeing any changes and whether they are still committed to their metaverse investments will be big factors in this report.
Amazon.com ($AMZN) reports on Thursday after hours and, like Facebook, has also shared its bit of bad news. While GAAP net income may be skewed by Amazon’s stake in Rivian Automotive Inc ($RIVN), revenue momentum and how the retailing and cloud giant is handling cost inflation will both be key items. Any read-through on how the recent Prime Day sets the company up for Q3 and the back half of the year will also be important for investors.
Last but the opposite of least, Apple ($AAPL) also reports on Thursday after hours. The champ in enterprise value among its mega-cap tech peers, Apple has also outperformed the group in 2022, down only 13.2% year to date, even ahead of the S&P 500.
Key Economic Calendar (Weekly)
A bevy of CPI and GDP numbers comes out towards the end of the week. While much of this will be backwards looking, it may still give a hint of what’s to come for the economy and central bank behavior.
U.S. GDP is expected to be positive, which would avert the technical definition of a recession, namely two consecutive quarters of negative real GDP growth. U.S. Core PCE prices are expected to jump to a growth of 0.5% month over month, from 0.3% last month.
All times listed are EDT
Tuesday
10:00: US –CB Consumer Confidence: forecast to decrease from 98.7% to 96.8%
Wednesday
14:00: US- FOMC Statement
14:30: US- FOMC Press Conference
Thursday
8:30: US- Advance GDP q/q: expected to be positive at 0.4% from -1.6% in the previous quarter.
Friday
8:30: US –Core PCE Price Index m/m: predicted to increase to 0.5% from 0.3%
Top 3 Leading and Lagging Sectors (Weekly)
The best-performing sector was the consumer discretionary sector (+5.5%), which was helped by a huge move in Tesla ($TSLA) after its better-than-feared Q2 report, followed by the industrials (+4.1%), technology (+4.1%), and energy (+3.5%) sectors.
Conversely, two of the three sector losers this week were the communication services (-1.1%) and utilities (-0.1%) sectors.
The communication services sector was dragged by poor earnings from some of its mega cap constituents. Gloomy earnings results and/or guidance from AT&T ($T) and Verizon ($VZ), coupled with the retreat in Alphabet ($GOOG) and Meta Platforms ($FB) after Snap’s disappointment, undercut the sector. Snap ($SNAP) for its part plummeted -39% on Friday. Netflix ($NFLX) did what it could do to lend support, rallying nicely after its better-than-feared Q2 earnings report.

Market Breath (Weekly)
% of Stocks Above 50 DMA = 54.69% (+46.43%)
% of Stocks Above 200 DMA = 22.55% (+18.75%)

Market Technicals – (S&P 500, NASDAQ, Bitcoin, Bonds & Credit Spread, NAAIM)

$SPX (S&P 500) vs $RSP (S&P 500 Equal Weight) – (Net High/Low +25)
$SPX closed the week with gains of +2.55% last week, closing at its highest level (3,961) since 9th June 2022. In turn, $SPX also reclaimed a posture above its 50-day moving average for the first time since April 2022.
The irony is that the stock market has gotten better as the economic and earnings news has gotten worse. Some will interpret that as a sign that the stock market has hit a bottom. Others will simply call it a bear market rally. That is, things fell so much that they were due for a bounce, yet the continued deterioration in economic and earnings growth should lead to a resumption in selling interest. What we know for certain is that more companies are prepping for a period of slower growth, if not an actual recession.
At the current junction, the index along with $RSP have traded out of its bullish descending wedge pattern, recapturing its rising 10/20-day moving averages successfully. It is worth to note that $RSP is reflecting consistent diminishing volume since the middle of June 2022, a sign of bearish divergence in this short term market rally.
The support to watch for this week is at 3,725 level, an immediate minor support level that would also slice through the existing rising 10/20-day moving averages.

$QQQ (Nasdaq 100) vs $QQQE (Nasdaq 100 Equal Weight) – Remains the Weakest Major Index Year To Date, But Relative Strength Observed
Tech and growth names have been hard hit since the start of 2022 by a rapid rise in Treasury yields on the back of expectations that the Fed will hike interest rates aggressively to combat high inflation as higher rates can hurt their companies with high valuations based on the prospect of future profits.
$QQQ remains as the weakest major index year to date with -24.4% return. $QQQ posted a weekly gain of +3.47% for the week, affirming its relative strength against $SPX since 25th May, At the current juncture, $QQQ have traded out of its month long Bullish Ascending Triangle pattern that was highlighted last week.
The support level to watch for $QQQ this week is at $280, an immediate minor support level that would also slice through the existing rising 10/20-day moving averages.

$BTCUSD (Bitcoin / USD) – Second Bearish Flag Formation For Bitcoin
Bitcoin ($BTCUSD +8.62%) second successive bearish flag formation remains in play.
The level of support to watch for $BTCUSD this week remains at $17,500, the lowest level year to date.

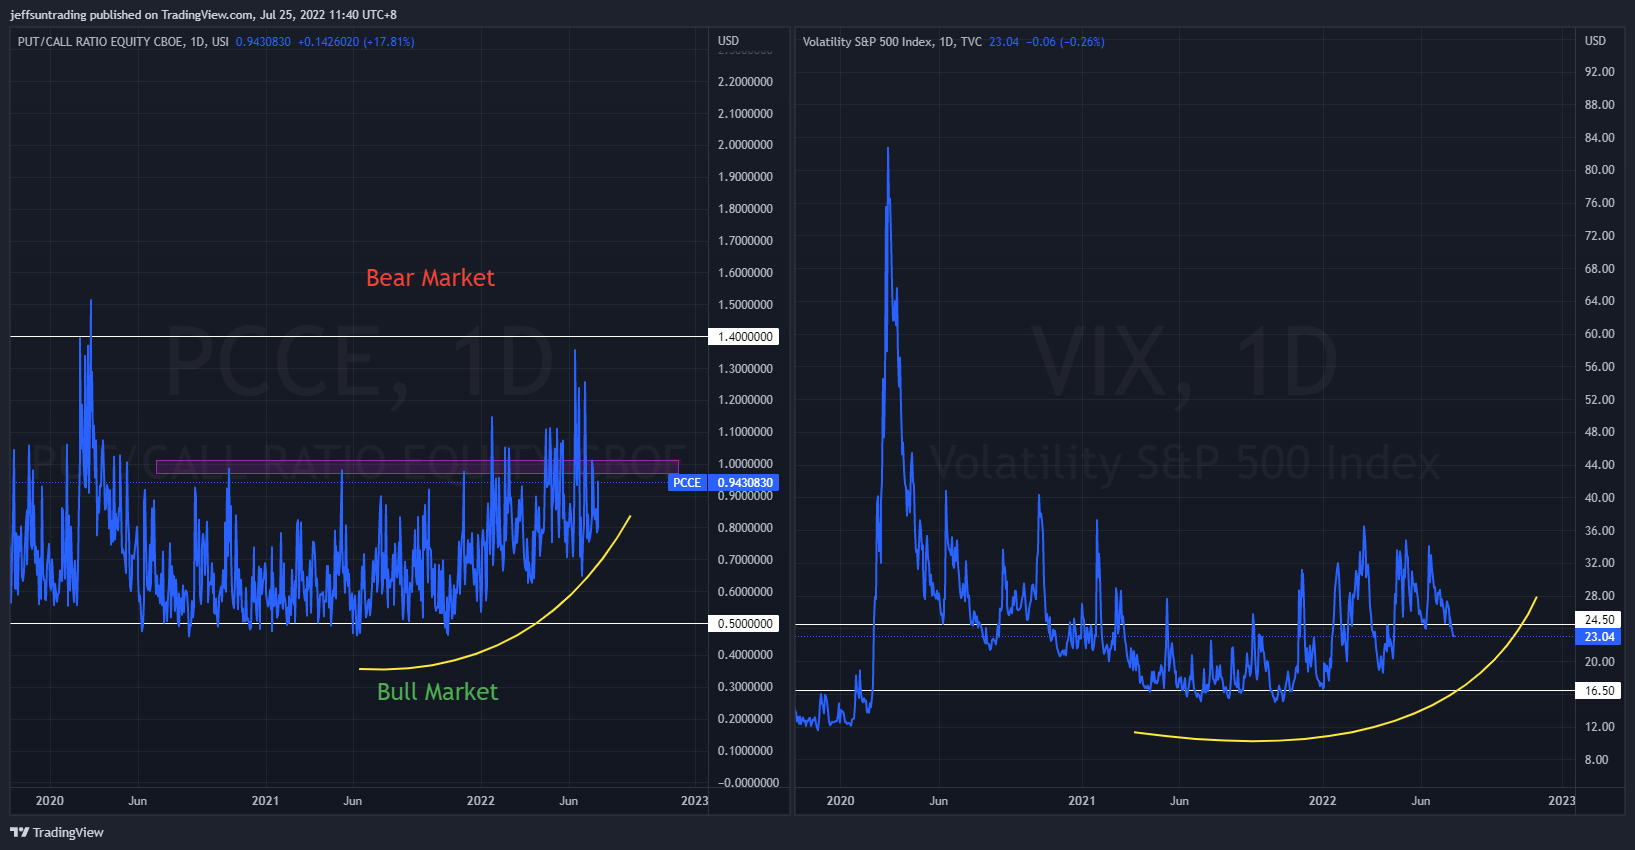
$PCCE (Put/Call Ratio Equity) & $VIX (Volatility S&P 500) – Persistence in Reflection of Imminent Major Sell Off Ahead
VIX >30 is assumed to accompany large volatility, resulting from increased uncertainty, risk, and investor fear. VIX <20 generally correspond to stable, stress-free periods in the market. Higher VIX levels equates to more expensive options premium and vice versa for lower VIX level.
The spike level to watch for $PCCE in the last 24 months period is at 1.00. The current reading of 0.943 (+11.88%) remains elevated and poses likelihood and risk of accelerated selling for this week.
Conversely, the CBOE Volatility index ($VIX), also known as Wall Street’s fear gauge, declined to 23.04 (-4.87%).
The weekly build up in momentum of both $PCCE and $VIX is reflecting a major sell off ahead remains imminent for the equities market.

$IEI/$HYG (Credit Spread) – $TNX (10YR Treasury Yield) – Highest Credit Spread Level Since November 2020 registered in June 2022
Market participants are keeping a close watch on credit spreads as one of the better economic signals. Junk bond issuers are perceived to be bigger credit risks, so if economic growth slows or contracts, there will be increased angst that these issuers won’t be able to make good on their interest payments. Hence, a widening high-yield spread is regarded as a leading indicator of difficult economic times which, in turn, often invites a more challenging period for the stock market since difficult economic times translate into weaker earnings prospects.
Credit Spread further edge down to 1.57% (-0.01) after setting a high of 1.62% at the end of June as the volatility in the equity market resumes. This was the highest spread level since November 2020.
The deteriorating economic environment registered more in the Treasury market than it did in the stock market. The 2-yr note yield fell 14 basis points for the week to 2.99% and the 10-yr note yield fell 15 basis points for the week to 2.78%. The inversion, whereby shorter-dated securities yield more than longer-dated securities, is a reflection of growth concerns and is seen by some as a harbinger of a possible recession.

NAAIM Exposure Index 44.48 (+66.34%)
The NAAIM Exposure Index represents the average exposure to US Equity markets reported by members of the National Association of Active Investment Managers. It provides insight into the actual adjustments active risk managers have made to client accounts over the past two weeks. The blue line depicts a two-week moving average of the NAAIM managers’ responses.
This week’s NAAIM Exposure Index number is: 44.48
Top Trading Ideas for the Week
$PRVA – Healthcare | Health Information Services
healthcare sector is the top performing sector on basis of 1 month relative strength. $PRVA currently trading above all KMAs, along with key VWAPs (IPO & ATH). have also cleared a key pivotal level at $33 this week. pic.twitter.com/tInJb9fdUB
— Jeff Sun, CFTe (@jeffsuntrading) July 8, 2022
$GTLB – Technology | Software – Application
another tech name; resilient in RS, trading to its rising 10/20 MAs, based at $32 major support since March. have reported stable, increasing qtr sales number since IPO.
currently trading just beneath its IPO VWAP, similar to $DUOL pic.twitter.com/4MKrTK8QMJ
— Jeff Sun, CFTe (@jeffsuntrading) July 8, 2022
$BMBL – Technology | Software – Application
probably the weakest of the lot I shared today as this only came to my attention today.
but anything with YTD RS high, above all KMA with 3 months base pattern will definitely be in my WL. pic.twitter.com/tI9Ejt5XgI
— Jeff Sun, CFTe (@jeffsuntrading) July 8, 2022

