
It was a tremendous week of market volatility for Wall Street as each of the major indices fell more than 2.0% this week with the market remaining pressured by growth concerns, heightened volatility, and downwards momentum. The Nasdaq Composite lost 2.8%, the Russell 2000 lost 2.6%, the S&P 500 lost 2.4%, and Dow Jones Industrial Average lost 2.1%.
Friday’s end of week bounce in equity markets came amid hopes markets are near the bottom, but trouble may not be over yet with investors looking for further clues on the course of Fed monetary policy and monitoring earnings result from big retailers. Crypto investors will also be monitoring the fallout after a massive price collapse.
Here’s what you need to know to start your week.
1. Retail earnings
Investors will be looking to a spate of retail earnings reports during the week for indications of just how much the cost of living squeeze could be eroding the spending power of consumers.
The largest U.S. retailer Walmart ($WMT) and home improvement giant Home Depot ($HD) are both due to report fiscal first-quarter earnings before the market open on Tuesday. Target ($TGT) and Lowe’s ($LOW) are scheduled to report ahead of the open on Wednesday, followed by Macy’s ($M) on Thursday.
Investors will be looking particularly closely at retailers’ guidance for the second half of this year amid elevated inflation, higher wage and fuel costs and ongoing supply chain disruptions.
2. Crypto crash
Investors will be closely watching crypto assets in the week ahead after a volatile week last week, dominated by the collapse in value of stablecoin TerraUSD, which broke its 1:1 peg to the U.S. dollar.
Stablecoins are tokens pegged to the value of traditional assets, often the U.S. dollar, and are the main medium for moving money between cryptocurrencies or for converting balances to fiat cash.
Crypto assets have been swept up in broad-based selloff of risk assets amid concerns over elevated inflation and rising interest rates, but wider financial markets have so far seen little knock-on effect from the cryptocurrency crash. However, there could be significant negative repercussions if investors lose confidence in stablecoins, as many regulated financial entities have increased their exposure to the sector in recent months.
Key Economic Calendar (Weekly)
Economic data this week will be closely scrutinized as investors try to gauge whether aggressive tightening by the Fed to curb soaring inflation will result in a hard or soft landing for the economy.
Tuesday’s retail sales figures for April are expected to show solid gains thanks to steady auto sales. Economists are forecasting a 1.1% increase after a 0.5% rise in March, despite higher inflation.
Fed Chair Jerome Powell is to speak on Tuesday and is expected to reiterate that the U.S. central bank will hike rates by half a percentage point at each of its next two meetings.
All times listed are EDT
Tuesday
8.30: US – Retail Sales: forecast to rise to 1.1% from 0.5%
Top 3 Leading and Lagging Sectors (Weekly)
10 of the 11 S&P 500 sectors closed lower and five of which fell more than 3.0%, namely energy (-3.0%), real estate (-3.0%), technology (-3.1%), basic materials (-3.6%) and consumer cyclical (-3.7%). The consumer staples sector escaped the week with a +0.6% gain.
Growth concerns were heightened by the following developments:
- Expectations for the Fed to remain on its aggressive tightening plans amid inflation data that remained elevated
- Russia threatened retaliation if Finland follows through with plans to join NATO
- Reports indicating that Shanghai was again tightening COVID-19 restrictions, although there was hope that those restrictions would soon ease later this month
- The IEA lowered its global growth oil demand forecast

Market Breath (Weekly)
% of Stocks Above 50 DMA = 17.59% (-22.88%)
% of Stocks Above 200 DMA = 22.78% (-11.60%)

Market Technicals – (S&P 500, NASDAQ, Bitcoin, Bonds & Credit Spread, NAAIM)

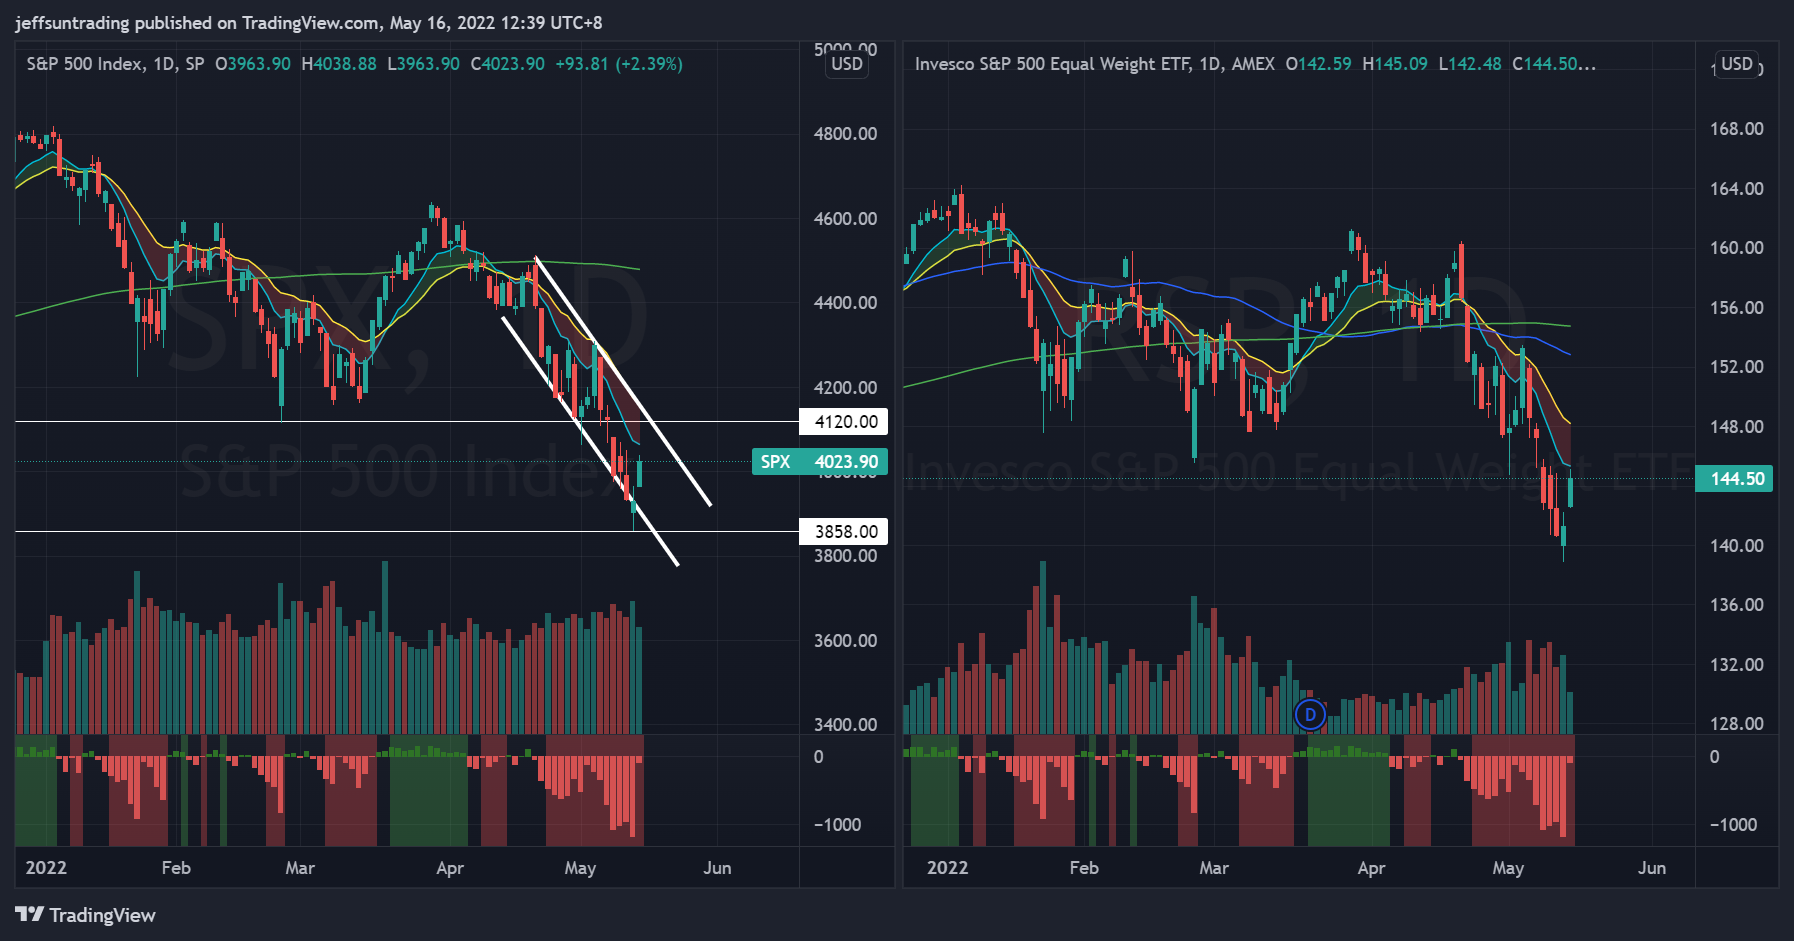
$SPX (S&P 500) vs $RSP (S&P 500 Equal Weight) – (Net High/Low -76)
The S&P 500 ($SPX) fell -2.41% last week. $SPX remains trading below all of its major moving averages and have now morphed into a month long downtrend channel.
Market ended higher on Friday after another volatile week in markets as hopes that inflation may be close to peaking were offset by fears that aggressive policy tightening by the Fed could tip the economy into recession. Despite Friday’s gains, $SPX posted its sixth straight weekly loss, while the Dow recorded its seventh consecutive weekly decline.
The immediate support to watch for this week is at 3,858 level, the lowest level traded for the whole of 2022. Recapturing 4,120 would have $SPX breaking out of its downtrend channel, along with its declining short term moving averages (10-day and 20-day)

$QQQ (Nasdaq 100) vs $QQQE (Nasdaq 100 Equal Weight) – Trading Towards 2 Year Low
Tech and growth names have been hard hit since the start of 2022 by a rapid rise in Treasury yields on the back of expectations that the Fed will hike interest rates aggressively to combat high inflation as higher rates can hurt their companies with high valuations based on the prospect of future profits.
$QQQ fell -2.368% over the week, further setting a new lowest level year to date at $301. Similar to $SPX, $QQQ bearish momentum is also exhibited within its downtrend channel, along with its declining short term moving averages.
The support level to watch for $QQQ this week remains at $295.50, a support level that was last traded in March 2021.

$BTCUSD (Bitcoin / USD) – Bearish Head and Shoulder Pattern Remains In Play
Bitcoin ($BTCUSD) continues its weekly loss for the 6th consecutive week, falling -8.02% last week. It fell as much as -25% during the week, before recovering majority of that losses on Thursday. The session also marked Bitcoin’s highest trading volume session in 11 months. At the current juncture, the highlighted Bearish Head and Shoulder Pattern remains in play.
The next level of support to watch for $BTCUSD is at $25,400, a breakdown of Thursday’s reversal.

$PCCE (Put/Call Ratio Equity) & $VIX (Volatility S&P 500) – $PCCE And $VIX Remains At Elevated Level For Caution
The spike level to watch for $PCCE in the last 24 months period is at 1.00. This level has been flirted over with on 7 occasion over the past 6 weeks. The current reading of 0.872 (-9.96%) is its 2nd consecutive week of decline, implying a probable risk-on sentiment lurking at certain areas of the equity market. The critical level to watch for $PCCE is at 1.20 for further accelerated sell off in the equities market.
The CBOE Volatility index ($VIX), also known as Wall Street’s fear gauge, subdued to 29.60 (+2.56%), coming off from the highest level of 34.73 set last Monday.

$IEI/$HYG (Credit Spread) – $TNX (10YR Treasury Yield) – Yield Nearing 4 Years High
Market participants are keeping a close watch on credit spreads as one of the better economic signals. Junk bond issuers are perceived to be bigger credit risks, so if economic growth slows or contracts, there will be increased angst that these issuers won’t be able to make good on their interest payments. Hence, a widening high-yield spread is regarded as a leading indicator of difficult economic times which, in turn, often invites a more challenging period for the stock market since difficult economic times translate into weaker earnings prospects.
Credit Spread spiked with an increase to 1.56% over the week (+0.03). Meanwhile, the yield on the 2-yr note, which is most sensitive to changes in the fed funds rate, has declined to 2.934% (-6.02%). Growth concerns, peak inflation hopes, and a general flight to safety contributed to increased demand for Treasuries, which drove yields lower in a curve-flattening trade this week. The 10-yr yield also dropped 18 basis points to 2.94%.

NAAIM Exposure Index 24.31 (-7.45)
The NAAIM Exposure Index represents the average exposure to US Equity markets reported by members of the National Association of Active Investment Managers. It provides insight into the actual adjustments active risk managers have made to client accounts over the past two weeks. The blue line depicts a two-week moving average of the NAAIM managers’ responses.
This week’s NAAIM Exposure Index number is: 24.31, the lowest level of the past 24 months.
Top Trading Ideas for the Week
$NFE – Utilities
stellar result for Q1, with triple digits growth on both top and bottom line (+247% Sales YoY, +639% EPS YoY). price action consolidated within a flag setup since beginning of April.
RS is already at NH with latest price action breaking out of a DTL and VWAP pic.twitter.com/wr8t8qFi7F
— Jeff Sun, CFTe (@jeffsuntrading) May 16, 2022
$SMCI – Computer Hardware
held the low of its post ER gap up, and closed at its week’s high on the latest session. exhibits remarkable RS for the past 4 weeks. trading above all major moving averages.
this is one of the few names in my watchlist that held to its rising 10/20 MA pic.twitter.com/Cti4mrlSHO
— Jeff Sun, CFTe (@jeffsuntrading) May 16, 2022
$AN traded out of its 9 months downtrend channel, establishing RS NH before price, and above VWAP from ATH.
currently above all its major moving averages, trading to its rising 10/20 MAs. a worthy setup could be designed around a breakout of its YTD high at $126.39. pic.twitter.com/s4rYHjKlDU
— Jeff Sun, CFTe (@jeffsuntrading) May 16, 2022

