

Note: U.S. Daylight Saving Time (DST) has ended on 6 November 2022 (Sunday 2:00am EST). Trading hours for U.S. markets will be an hour later for outside of Eastern Standard Time (EST).
Wall Street rebounded on Friday to close out a soft week, but the struggling equities rally will be tested in the coming days by the double-whammy of inflation data and U.S. midterms.
Despite Friday’s gains, the Dow fell -1.4% for the week to snap a four-week winning streak, the S&P 500 shed -3.3% for the week and the Nasdaq fell -5.6%, its largest weekly percentage decline since January. The October Employment Report reflected a labor market that isn’t showing enough weakness yet to convince the Fed that it can stop raising the target range for the fed funds rate. That point notwithstanding, the October employment situation was more consistent with achieving a soft landing for the economy than a hard landing.
U.S. inflation data on Thursday could bring some insight into when the Federal Reserve might start to slow the pace of rate hikes. The outcome of the U.S. midterm elections on Tuesday, where control of Congress is at stake will also be in focus. China is to release trade and inflation data as Beijing’s zero-COVID policy continues to wreak economic damage.
Here’s what you need to know to start your week.
1. U.S. midterm elections
The U.S. is gearing up for midterm elections on Tuesday where control of Congress and President Joe Biden’s agenda for the remaining two years of his term are at stake.
Republicans have been leading in polls and many analysts believe the likely result will be a split government, with GOP control of the House of Representatives and possibly the Senate for the second half of Biden’s term. U.S. stocks have performed better in periods of divided government, with average annual S&P 500 returns of 14% in a split Congress and 13% in a Republican-held Congress under a Democratic president, compared with 10% when Democrats controlled both presidency and Congress.
Democrats’ electoral hopes have been hammered by voter concerns about high inflation, and Biden’s public approval rating has remained below 50% for more than a year, coming in at 40% in a recent Reuters/Ipsos poll.
2. China data
Chinese and Hong Kong stocks jumped sharply on Friday amid speculation that Beijing may soon ease its strict zero-COVID curbs, but officials said on Saturday that the country was sticking to its policy.
China is to release data on trade, inflation and new loans this week which are expected to point to ongoing weakness in the world’s second largest economy as COVID curbs sap demand.
Beijing is also due to release data on foreign exchange reserves, which are being depleted as authorities seek to shore up the yuan which is on track for its worst year since 1994.
Down for eight months in a row, China’s foreign currency reserves are within a whisker of the psychological $3 trillion level amid broad-based dollar strength since the Fed began raising rates in March.
Key Economic Calendar (Weekly)
The U.S. is to release inflation figures for October on Thursday with market watchers on the lookout for indications that price pressures are cooling after a barrage of outsize rate hikes by the Fed.
Fed Chairman Jerome Powell said last week that policymakers will likely take rates higher than envisioned in their attempt to curb soaring inflation, so a hotter-than-expected reading would likely cement expectations for the Fed to continue its hawkish path.
But a cooler-than-expected reading could see markets become more focused on the higher probability of a recession.
Economists are expecting the annual rate of inflation to come in at 8.0% and the monthly rate of inflation to rise by 0.6%.
All times listed are EST
Tuesday
US – Congressional Elections
Thursday
8:30 US – CPI m/m: forecast to increase from 0.4% to 0.6%
8:30 US – CPI y/y: forecast to decline from 8.25% to 8.0%
Friday
10:00 US – Prelim UoM Consumer Sentiment: forecast to decline from 59.9 to 59.5
Top 3 Leading and Lagging Sectors (Weekly)
Only three sectors out of the 11 total were able to squeeze out a gain on the week. Basic materials and energy stocks closed with the big weekly gain at upward of 2.3%. Communication and technology were dragged with losses exceeding -6.0%.

Market Breath (Weekly)
% of Stocks Above 20 DMA = 65.73% (-15.31%)
% of Stocks Above 50 DMA = 52.31% (-5.76%)
% of Stocks Above 200 DMA = 34.56% (-3.19%)


Market Technicals – (S&P 500, NASDAQ, Bitcoin, Bonds & Credit Spread, NAAIM)

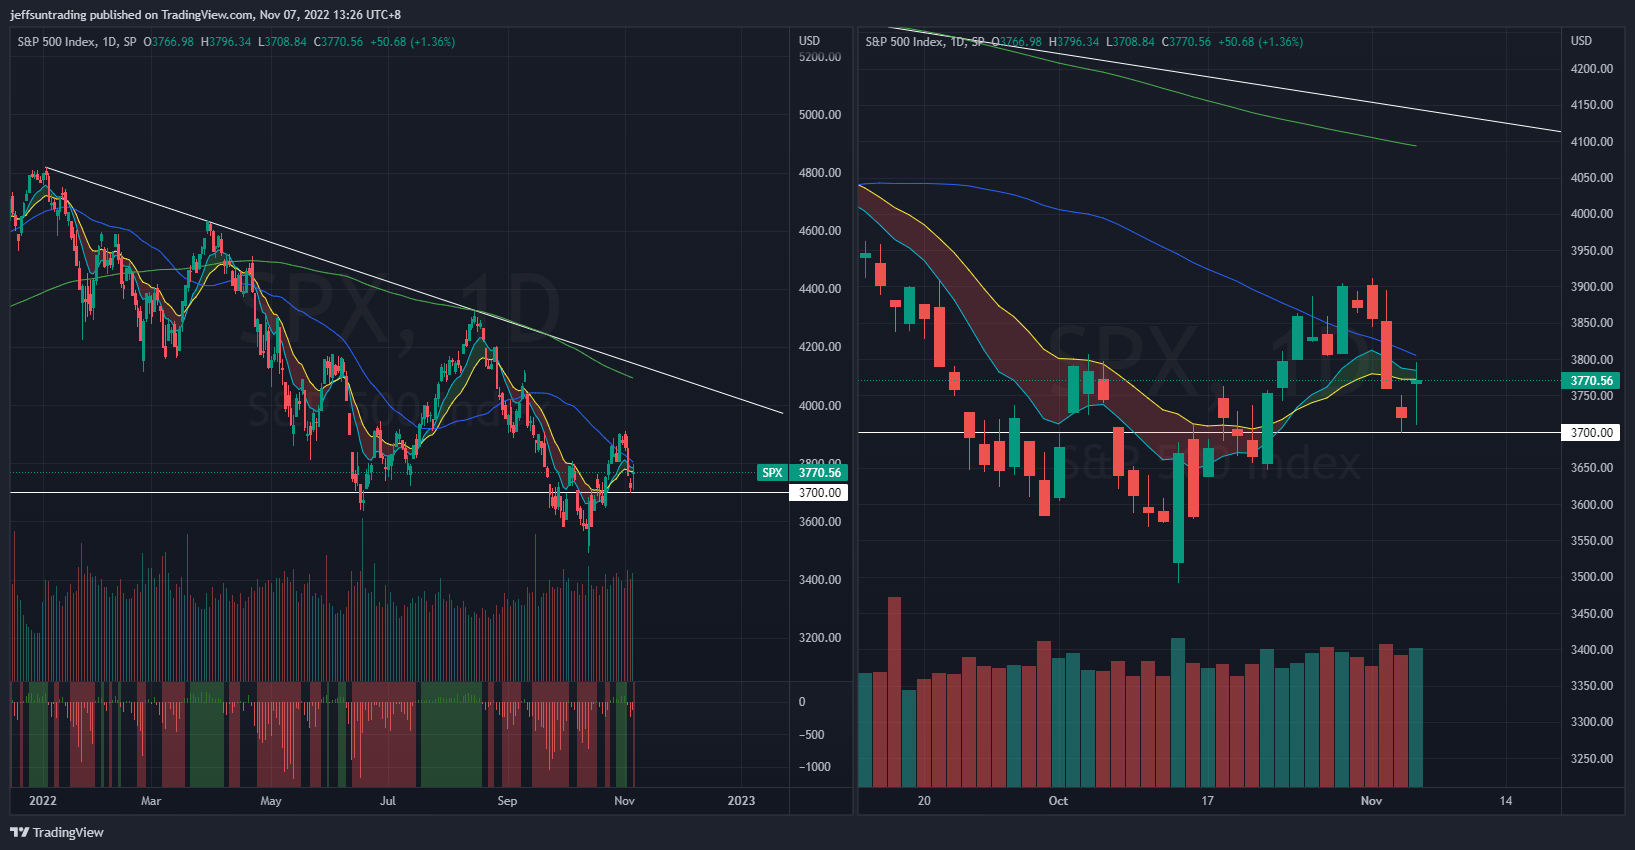
$SPX (S&P 500) – (Net High/Low -105)
A hard landing for the economy was a prominent concern for market participants as the central banks ramped up their fight against inflation. It led to broad-based selling, rooted in worries that there will soon be large cuts to earnings estimates. Accordingly, there was a reticence to pay up for stocks and an inclination to take risk off the table.
$SPX fell -3.35%, after attempts to remain above its declining 50-day moving average during the week. Friday’s rebound on the ascertain the 3,720 support level that was highlighted in the previous week. Market participants received earnings reports from over one third of the companies in the S&P 500 this week. Per usual, there were some big winners and big loser, yet macro factors tended to overshadow the individual earnings reports.
$SPX currently sits within a flattening 10/20-day moving average, with likelihood of a further reattempt to capture its 50-day moving average at 3,800 level. The support to watch for this week remains at 3,720 level, a clean breach of $SPX rising 10 & 20-day moving average.
Bull Case: Reclaim above 3,900, a previous high level that will also reclaim above the existing 50-day moving average.
Bear Case: Breakdown of 3,720 level, breaching its rising 10 & 20-day moving average. Next support at 3,490 level.

$QQQ (Nasdaq 100) – Higher Treasury Yields To Continue Painful Transition For Stocks
Tech and growth names have been hard hit since the start of 2022 by a rapid rise in Treasury yields on the back of expectations that the Fed will hike interest rates aggressively to combat high inflation as higher rates can hurt their companies with high valuations based on the prospect of future profits.
$QQQ fell -5.88% for the week, remaining as the weakest major index year to date with -33.0% return. $QQQ is also the only major index that remain below all its major moving averages.
The support level to watch for $QQQ this week is revised lower to 254 after breaching the 267 level highlighted last week.
Bull Case: Reclaim above 282 declining 50-day moving average.
Bear Case: Breakdown of 254 level, the lowest level year to date. The next support level is at 232.

$BTCUSD (Bitcoin / USD) – Price and Volume Contraction On Weekly Chart Continue to Reflect Bearishness
Bitcoin ($BTCUSD) gain +1.35% for the week, remaining above three of its key moving averages during week (10, 20, and 50-day moving averages).
$BTCUSD’s Bearish Pennant pattern is violated but with price consolidation and volume contraction remaining in its weekly chart, a longer term Bearish Flag channel is now morphed out, prompting the risk of a a further accelerated sell off in near term remains.
The level of support to watch for $BTCUSD this week remains at to $18,800, a level that undercuts the existing three key moving average that was recaptured.
Bull Case: Violation of existing Bearish Flag channel at $22,000.
Bear Case: Breakdown of $18,800, a level that undercuts the existing three key moving average that was recaptured. Next support level at $18,157.

$PCCE (Put/Call Ratio Equity) & $VIX (Volatility S&P 500) – Persistence in Reflection of Imminent Major Sell Off Ahead
VIX >30 is assumed to accompany large volatility, resulting from increased uncertainty, risk, and investor fear. VIX <20 generally correspond to stable, stress-free periods in the market. Higher VIX levels equates to more expensive options premium and vice versa for lower VIX level.
The spike level to watch for $PCCE in the last 24 months period is at 1.00. The current reading is 0.838 (-2.73%).
Similarly, the VIX volatility index, also known as Wall Street’s fear gauge declined to 24.56 (-4.62%).
The weekly build up in momentum of both $PCCE and $VIX is reflecting a major sell off remains imminent for the equities market ahead.

$VIX/VXV – Reading at 0.92 (Tranquility)
The VIX/VXV measures the ratio between 1-month implied volatility and 3-month implied volatility, which is helpful as it filters out higher baseline readings on VIX.
- If it is greater than one, it implies uncertainty, negative for equities. On the contrary, such high reading (i.e. spikes) coincide with market bottoms.
- If it is less than one, it implies tranquility, favorable for equities.
- If it is below 0.82, the returns for S&P500 are often less than stellar.

$IEI/$HYG (Credit Spread) & $TNX (10YR Treasury Yield) – 10-Year US Treasuries Yield On Track For Year Till Date High
Market participants are keeping a close watch on credit spreads as one of the better economic signals. Junk bond issuers are perceived to be bigger credit risks, so if economic growth slows or contracts, there will be increased angst that these issuers won’t be able to make good on their interest payments. Hence, a widening high-yield spread is regarded as a leading indicator of difficult economic times which, in turn, often invites a more challenging period for the stock market since difficult economic times translate into weaker earnings prospects.
Credit Spread inched up to 1.55 (+0.02) for the week. The year to date high level is at 1.64 set in early July.
Treasury yields were on the rise in anticipation of Wednesday’s FOMC decision, but yields really moved up after that. The 2-yr Treasury note yield rose 25 basis points this week to 4.67%. The 10-yr note yield ($TNX) rose 15 basis points this week to 4.16%.

NAAIM Exposure Index 55.22 (+2.43%)
The NAAIM Exposure Index represents the average exposure to US Equity markets reported by members of the National Association of Active Investment Managers. It provides insight into the actual adjustments active risk managers have made to client accounts over the past two weeks. The blue line depicts a two-week moving average of the NAAIM managers’ responses.
This week’s NAAIM Exposure Index number is: 55.22 (Wednesday)
Top Trading Ideas for the Week
$TALO$VRT$INMD$PARR pic.twitter.com/quwIQm4jA2
— Jeff Sun, CFTe (@jeffsuntrading) November 7, 2022
Do follow me on twitter for more daily trading ideas.