
The S&P 500 ($SPX) declined further (-0.29%) for the week, dragged down by declines in major bank after earnings results raised concern over decline in trading revenues and loan growth within the economy. With the Investors fixated on inflation and monetary policy on recent months, the focal point would be shifted to upcoming Q4 earnings following the official kick-off of the season last Friday.
Earnings for financial sector will particularly be in focus. Earnings results will test growth stocks just as investors are bracing for the Federal Reserve to begin hiking interest rates. The U.S. economic calendar is light in a holiday-shortened week, with U.S. markets closed Monday for Martin Luther King Jr. Day. Increasing momentum in $PCCE and $VIX is also bringing cautionary signals to the stock market.
Here’s what you need to know to start your week.
1. Earnings
Financial sector earnings during the week will include fourth quarter results from Goldman Sachs ($GS), Charles Schwab ($SCHW) and BNY Mellon ($BK) on Tuesday, followed by Morgan Stanley ($MS) and Bank of America ($BAC) on Wednesday. Bank executives are expected to be upbeat on the outlook, but as some analysts have noted, bank stocks often do better ahead of rate hikes than they do during rate increases.
Big non-financial firms reporting include Procter & Gamble ($PG) on Wednesday and Netflix ($NFLX) on Thursday, the first of the closely watched “FAANG” companies to do so. Investors will be paying close attention to the streaming giant’s plans for new content and its outlook for subscribers.
2. Test for growth stocks?
U.S. tech and growth stocks have got off to a rough start in 2022, raising the stakes for this earnings season, as investors look for reasons to remain steadfast ahead of expected rate hikes by the Fed.
Tech bulls hope a strong earnings season can reverse declines driven by rising Treasury yields and expectations that the Fed will tighten monetary policy and hike rates aggressively to fight inflation.
As the Fed increases short-term rates, investors will keep an eye on how high longer-term U.S. Treasury yields rise. Higher yields mean a greater discount on future profits, a negative for growth stocks.
Key Economic Calendar (Weekly)
The U.S. economic calendar is light in a holiday-shortened week, with U.S. markets closed Monday for Martin Luther King Jr. Day.
All times listed are EST
Monday
Martin Luther King, Jr. Day, US Markets are closed
Wednesday
8:30: US – Building Permits: expected to retreat to 1.701M from 1.717M.
Thursday
8:30: US – Initial Jobless Claims: expected to slump to 220K from 230K.
8:30: US – Philadelphia Fed Manufacturing Index: to surge to 20.0 from 15.4.
10:00: US – Existing Home Sales: forecast to slip to 6.43M from 6.46M.
Top 3 Leading and Lagging Sectors (Weekly)
1. $XLE (Energy) +5.17%
2. $XLC (Communication) +0.16%
3. $XLK (Technology) -0.10%
Benchmark: $SPY -0.29%
1. $XLRE (Real Estate) -1.99%
2. $XLV (Healthcare) -1.48%
3. $XLU (Utilities) -1.43%
Market Breath (Weekly)
% of Stocks Above 200 DMA = 44.02% (-1.39%)
% of Stocks Above 50 DMA = 42.01% (+0.24%)
Market Technicals (Rally Cycle Count: Day 19 of 25)

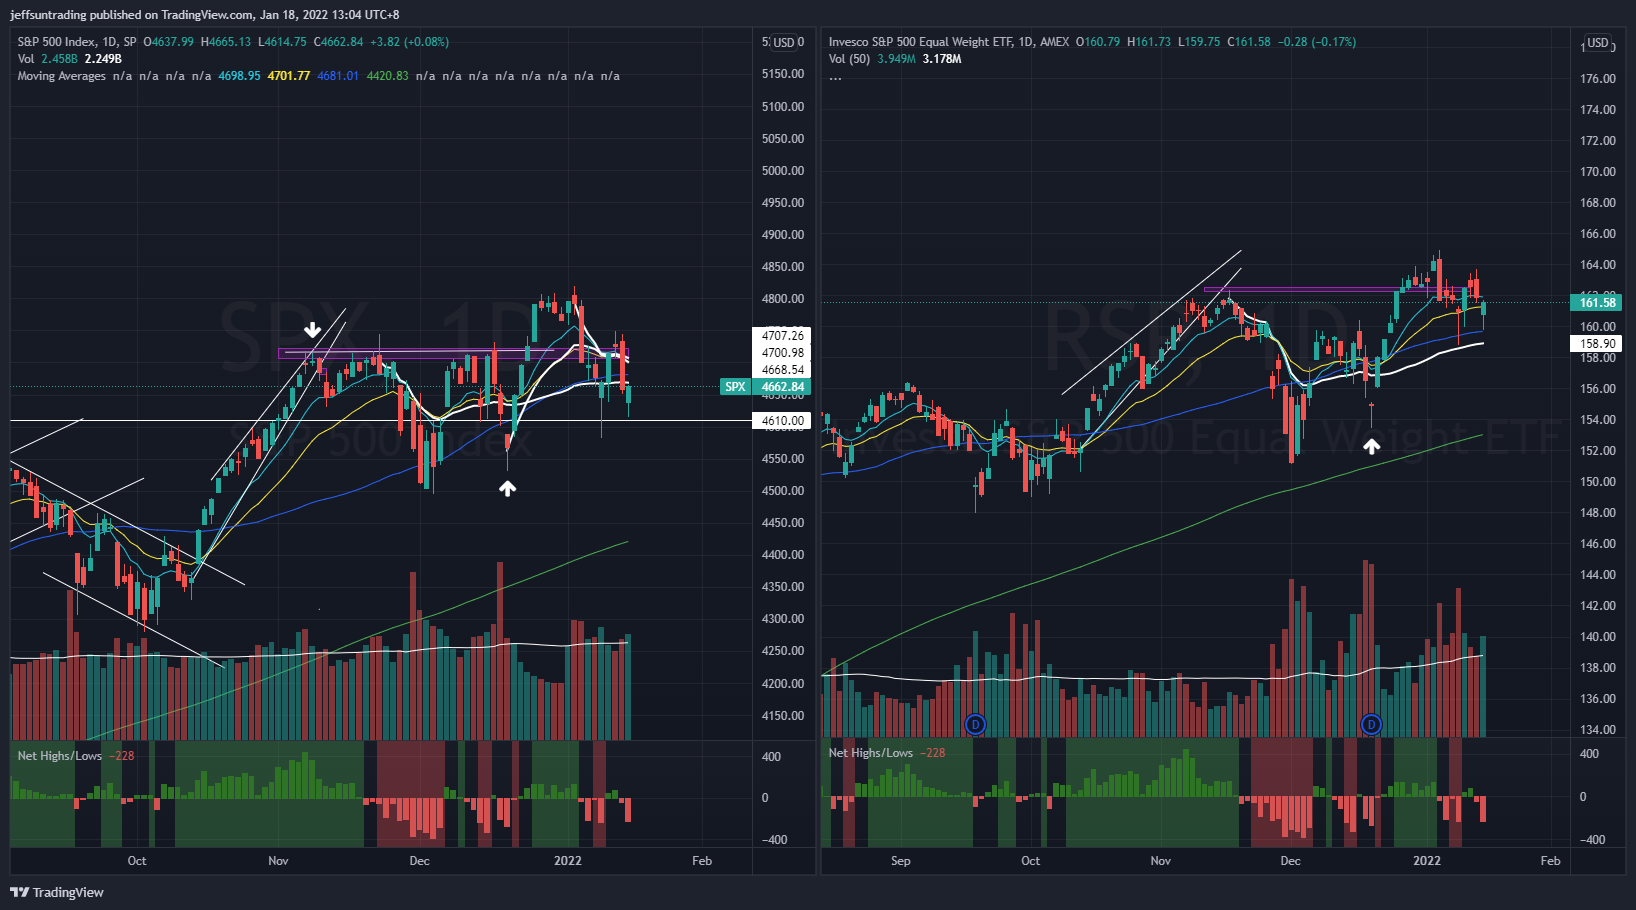
$SPX (S&P 500) vs $RSP (S&P 500 Equal Weight) – (Net High/Low -228)
$SPX further declined -0.29%, closed beneath its 50D Moving Average at 4,662 level. There were several failure attempts by $SPX to break beyond its ATH VWAP at 4,700 level, morphing out a short term lower high. With $SPX aided by a late bull charge rally on the stock market Friday, its Net High/Lows have severely deteriorated with -288 companies within its constituents.
The immediate support to watch for $SPX this week is at 4,610 level, a break of the latest day candle low. The break down of this level may accelerate further selling for the week as this move would be dictated by the potential downbeat of Q4 earnings of the mega caps this week.
Do note the 50MA for $SPX has been a key technical level that has attracted dip-buying efforts since February 2021.

$QQQ (Nasdaq 100) vs $QQQE (Nasdaq 100 Equal Weight)
The week’s decline in $QQQE is -0.21% as it got resisted at its all time high VWAP that it broke during the previous week. Additionally, $QQQE have also broke down from its multi-month long uptrend support, declining to its rising 200MA that it last breached in March 2020.
$QQQE have now morphed into a bearish head and shoulders chart pattern with declining short term moving averages (10 and 20). The breakdown of this chart formation in $QQQE would likely see $QQQ retrace back its 200MA, 4,10% away from its latest closing level.
The support level to watch for $QQQE remains at $80.80 level. This is a major support level that coincide with its rising 200MA.

$PCCE (Put/Call Ratio Equity) & $VIX (Volatility S&P 500)
The spike level to watch for $PCCE is at 1.00, where the current reading of 0.875 (+17.75%) reflects continual weakness in the current market environment.
$VIX reading similarly increase to 19.18 (+2.29%) also confirming the market correction we have experienced over the past week.
The increasing momentum of both $PCCE and $VIX to their inflection points would bring cautionary signal to reduce risk exposure on equity asset in the short term.

$IEI/HYG (Credit Spread) – $TNX (10YR Treasury Yield)
Credit Spread remains at 1.48% over the week. Similarly, $TNX also remains flat at 1.77% (+0.06%), a 2 years high. The year’s momentum in $TNX is like to see TNX reaching 1.95% by end of January.
Top Trading Ideas for the week
$UCTT supported on its ATH VWAP support with a cup and handle pattern. Friday’s high volume ($50mil dollar vol vs $20mil avg dollar vol) strong close at +7.6%, exceeds its ATR of 4.74%.
fundamentally strong company. what I dislike is that it doesn’t trend cleanly on its 50MA pic.twitter.com/HS8C5uvlud
— Jeff Sun, CFTe (@jeffsuntrading) January 18, 2022
$RHI a 2021 market darling until the last week of November, where it undercut its 50MA for the rest of the year. currently established a higher low with cup and handle pattern. weekly chart, it capture back its 10MA for the first time in 7 weeks.
actionable trade for today pic.twitter.com/BXLMVeyrjh
— Jeff Sun, CFTe (@jeffsuntrading) January 18, 2022
$MEOH that’s a beautiful push to wrap up its week. mean reversion setup on weekly is triggered pic.twitter.com/xVoQzTVd6E
— Jeff Sun, CFTe (@jeffsuntrading) January 17, 2022

